Trading Update: Thursday October 21, 2021
Emini pre-open market analysis
Emini daily chart
- Yesterday rallied to within a few points of the September all-time high, but it closed in the middle of the day’s range.
- The 3-week rally has been strong enough to make a new high likely within a few days. It could come today.
- If there are consecutive bull bars closing at a new high, traders will begin to look for a measured move up, based on the 4-month trading range. That would be around 4800.
- If the bulls get that, traders would then wonder if the rally will continue up to the 5,000 Big Round Number without more than a 3 – 5% correction.
- The bears want a double top with the September high.
- Most of the time when there is a double top, the 2nd leg up is weak. For example, it is often a wedge rally.
- As strong as the rally has been over the past few weeks, it is important to understand that in a third of double tops, the 2nd leg up is a buy climax, like this one.
- Therefore, if there is a bear signal bar closing near its low within the next week, many bulls will exit below and bears would begin shorting, betting on a double top with the September 2 all-time high.
- A rally to a prior high typically stalls around the old high. This increases the chance of sideways trading for a few days. This is especially true with the 60-minute chart as overbought as it is.
- The bulls who bought at the first high are relieved to be able to exit without a big loss, and the bulls who bought the bottom of the selloff take profits. Some bears also sell.
- Traders wonder if there will be a 2nd reversal down, creating a double top.
- This is what we will find out at some point within a couple weeks. If there is a strong breakout to a new high, traders will expect at least a couple legs up and possible a measured move up.
- If there is a reversal down, traders would look for a couple legs down to at least the middle of the trading range.
- I have mentioned the outside down bar in September on the monthly chart several times. October traded below September’s low and is now just below September’s high.
- If October breaks above the September high, it will be an outside up bar after an outside down bar. That is an OO (outside-outside) pattern, which is Breakout Mode.
- Since the monthly chart is so overbought, if there is a bull breakout above the OO (if the OO forms), the OO might become the Final Bull Flag.
- That means traders would look for a reversal back down within a few months. A reversal down would probably last 2 to 3 months.
Emini 5-minute chart and what to expect today
- Emini is down 8 points in the overnight Globex session.
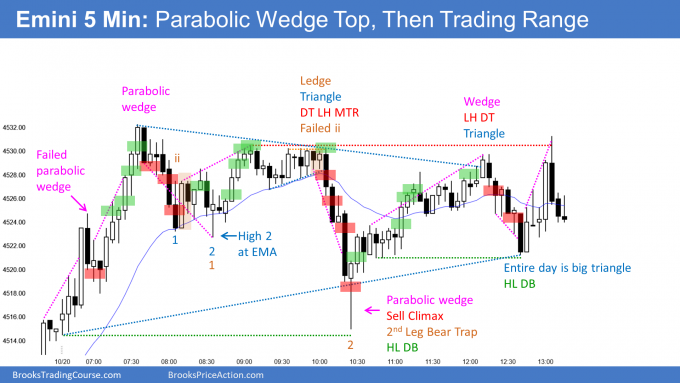
- Yesterday formed a double top lower high major trend reversal.
- There was also a lower high double top. Yesterday’s low is the neckline of that double top.
- Today will open around yesterday’s low. A break below yesterday’s low would trigger the double top sell signal.
- There would also be a double top on the daily chart with the September high.
- However, the bull trend has been very strong and yesterday was a bull bar. Therefore, there will probably be buyers not far below yesterday’s low. A 1- to 3-day pullback is more likely than a trend reversal on the daily chart.
- Whenever there is a buy or sell signal, there is an increased chance of a trend day. The trend can be in either direction. That means a break below yesterday’s low could reverse up into a bull trend day.
- Yesterday’s range was small. If today reverses up from below yesterday’s low to above yesterday’s high, today would be an outside up day.
- Since the all-time high is only a few points above yesterday’s high, a break above yesterday’s high could break to a new all-time high.
- Since that would be another breakout, it could also lead to a big move in either direction.
- What is most likely? As I said, since the rally is testing a former high (the September all-time high), traders will probably need a few days to decide if there will be a big breakout or a reversal down. That means the Emini is most likely going to go sideways for a few days.
Yesterday’s Emini setups

Here are several reasonable stop entry setups from yesterday. I show each buy entry with a green rectangle and each sell entry with a red rectangle. Buyers of both the Brooks Trading Course and Encyclopedia of Chart Patterns have access to a much more detailed explanation of the swing trades for each day (see Online Course/BTC Daily Setups).
My goal with these charts is to present an Always In perspective. If a trader was trying to be Always In or nearly Always In a position all day, and he was not currently in the market, these entries would be logical times for him to enter. These therefore are swing entries.
It is important to understand that most swing setups do not lead to swing trades. As soon as traders are disappointed, many exit. Those who exit prefer to get out with a small profit (scalp), but often have to exit with a small loss.
If the risk is too big for your account, you should wait for trades with less risk or trade an alternative market like the Micro Emini.
EURUSD Forex market trading strategies
EURUSD Forex daily chart

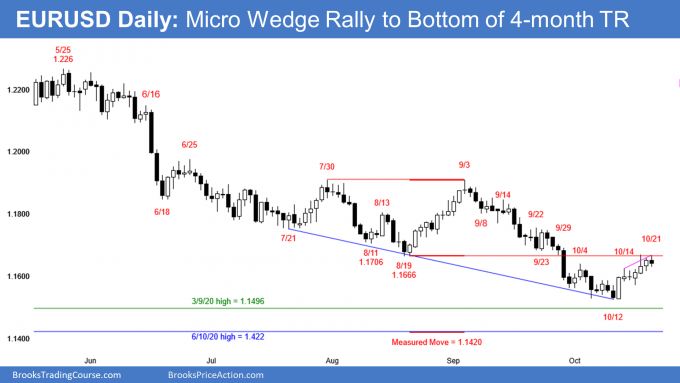
- Yesterday was the 6th consecutive bull candlestick after the reversal up from below the bottom of the yearlong trading range.
- Six consecutive bull bars is sustained buying. It increases the chance that the rally will continue higher before falling much below the October low.
- However, since it is unusual, it is climactic. That increases the chance of a test down soon.
- It tested above the August 19 low, which is resistance. It might go sideways for a few days while traders decide if the rally will continue or reverse down and test the October low.
- Today so far is a bear day. It is also a lower high micro double top with Tuesday’s high.
- If today closes near its low, it will be a sell signal bar. There would be a micro double top and a truncated micro wedge over the past 3 days. Truncated means that the 3rd high did not go above the 2nd high in the wedge.
- If there is a reversal down, traders would look for a test of the start of the wedge, which was the October 18 low. Below that is the October low, and then possibly the March 9, 2020 high, which was last year’s breakout point.
- I have said several times that the downside magnet is the March 9, 2020 high. Furthermore, I said that if the EURUSD gets there, it will probably not go much lower before reversing up for several weeks.
- Because the bear channel from the September high is tight, the current 2-week rally will probably be minor. That means there should be a test back down starting within a week or so.
- But if there is a test down, traders will buy around the October low. They expect this reversal up to test the September 3 high, whether or not there is a dip below the March 9, 2020 first.
- Traders are probably becoming more interested in buying selloffs than selling rallies.
Summary of today’s S&P Emini futures price action and what to expect tomorrow

End of day summary
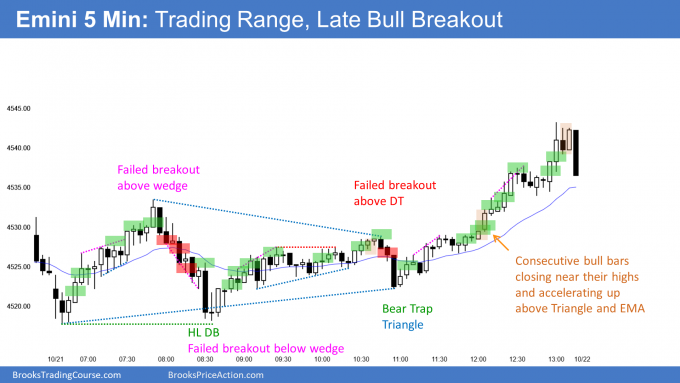
- Early rally to just above yesterday’s high, but reversed down again from just below all-time high. The Emini entered a triangle for 4 hours.
- Late breakout above triangle. Emini made a new all-time high.
- By breaking above September all-time high, October is now an outside up month. September was an outside down month. Consecutive outside bars forms an OO pattern, which means Breakout Mode.
- In November, the bulls want a breakout above the October high to trigger an OO buy signal.
- That would also be a breakout above the 4-month range. The bulls would then want a 267-point measured move up to 4802.
- Bears want breakout below the October low and at least a 267-point measured move down from below that low. After such a strong rally in October, November is more likely to go above the October high than below its low.
- Because of the strong rally on the daily chart and a breakout above the prior high, there is an increased chance of a strong rally over the next couple weeks.
- There is therefore an increased chance of a big gap up tomorrow or early next week.
- Can the bears get a higher high major trend reversal down? After such a strong rally over the past 3 weeks, the bears will probably need at least a micro double top before they can get a reversal down. It is too early to look for shorts.
- 7 consecutive bull bars is a strong rally. Bulls will buy the first one to three day pullback.
See the weekly update for a discussion of the price action on the weekly chart and for what to expect going into next week.
Trading Room
Traders can see the end of the day bar-by-bar price action report by signing up for free at BrooksPriceAction.com. I talk about the detailed S&P Emini futures price action real-time throughout the day in the BrooksPriceAction.com trading room. We offer a 2 day free trial.
Charts use Pacific Time
When I mention time, it is USA Pacific Time. The Emini day session charts begin at 6:30 am PT and end at 1:15 pm PT which is 15 minutes after the NYSE closes. You can read background information on the market reports on the Market Update page.


Thank you for your analysis. It’s always appreciated.
So confused after becoming consistently breakeven to profitable finally doing things differently.
I agree with all of your analysis but I can’t trade like you. I use your analysis but trade different.
For me EVERY TRADE STARTS AS A SCALP. Going for 2X when you don’t really know what will happen is a loosing strategy for me.
Not to mention as you’ve said before why just go for mediocrity? Personally need larger wins than my losses. A larger win/loss ratio NOT a higher win rate.
Yet if I follow your rules I’m getting in high on a stop and taking big risk and/or getting stopped out where the risk is the largest, where I’m exiting I should probably be entering, and the chance of a measured move is NOT worth the risk, as is in most of the cases with a MTR you don’t REALLY know the odds.
For ME… It’s MUCH easier to take a few small losses till you catch the trend.
Do you ever only use tight stops and look to re-enter?
Walmart trades have decimated my account a few times. Since I don’t take those anymore my tradings improved immeasurably.
Any thoughts on many small stops and HOLDING for large moves?
Thank you Dr. Brooks.
Al do you think back testing is necessary?
I cannot structure 2x reward trade daily but once in two days i can get swing setups with good reward.
In the mean time is it ok to take scalps or we can avoid trade?
I do not think back testing is worthwhile for most traders. It is far more complicated to get mathematically reliable results than what most people realize, and it is beyond their ability. Most people get results that are illusions that do not hold up in the real world.
Traders have a better chance of being consistently profitable if they swing trade. That means at least a couple legs and at least 10 bars. Swing trades from major reversals tend to last 2 or more hours. Most days have at least a couple swings, but swing trades often turn into scalps.
Scalping is very difficult to do consistently well. But once a person has a good understanding of price action, he might consider some scalping, especially when there is no strong trend.
thanks for the reply.
yes mostly my swing trades turn into 0.5x reward or 1x reward and start to reverse or there will not be enough time.
Al Brooks – “Traders have a better chance of being consistently profitable if they swing trade. That means at least a couple legs and at least 10 bars. Swing trades from major reversals tend to last 2 or more hours. Most days have at least a couple swings, but swing trades often turn into scalps.”
I have been through the course multiple times and been studying for years and this has always made no sense to me.
It’s always just about entry!
“That means at least a couple legs and at least 10 bars.”
What does that mean!!?!
What if it goes against you? What if it never comes back? What if in that time it goes one tick from target and come all the way back into loss? What if trade not valid anymore? What if it just against you the whole time?
This statement just makes no sense to me. It also contradicts alot of what you say, but you say it all the time.
I get it’s all about context but so much of these statements don’t mean anything without context… and have no context.
Appreciate everything but so confused.
Hi Al, can you explain why you didn’t label bar 50 as a possible swing buy? It thought it was a reasonable setup for a potential test of the H of day especially since it followed 3 CC bull bars and the last time it had 3 CC bull bars was around the O so I thought it was a good sign of bullish strength. Thank you
If you are talking about 50 today, which was an ii, I do have it labeled as a buy.
Hi Dr. Brooks,
What do you think about the big bear bars selling after 4:05pm?
Thank you.
One bar is not particularly important. That was a Final Flag reversal into the close by profit takers. The Emini might have to go sideways for a few days before continuing up. However, the 3 week rally is so strong that tomorrow might gap up tomorrow, despite that bar.
Hi, Al.
Would you explain why some wedges are good sell signals and some are not? For example, today there are a couple of wedges late in the day and you didn’t consider them good sell signals. Also, how is it possible to identify bear/bull traps? I was suspicious of that bear trap today but I can’t be certain when it’s happening in real time.
Thank you!
This question comes up regularly. Strong trends constantly form wedge reversals. The stronger the trend, the tighter the bull channel, the further from significant support or resistance, the more likely a wedge reversal will be minor.