Emini testing 2500 big round number before FOMC interest rate announcement
Updated 7:00 a.m.
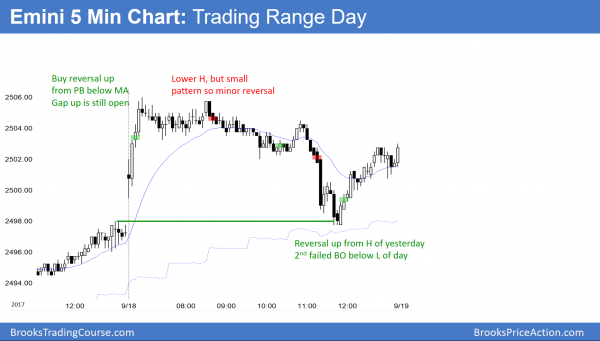
Today began with a bear doji that dipped back below 2500. Yet, the next bars were bull bars, and the gap remained open. Although this is a Buy The Close open, the bulls lacked consecutive big bull bars. Hence, the odds are against a big bull trend day today. Furthermore, every day last week had early buying, but ended up mostly sideways.
When there is a strong bull trend on the open, the bears try to create a parabolic wedge top. They then want an endless pullback that breaks into a bear trend. Their goal is a reversal day. The bulls try to create a bull channel after the initial spike up. Because today’s gap up was small, the 1st bar was a bear doji, and Wednesday’s uncertainty, the odds are against a strong bull trend day. However, the initial rally was strong enough to that the bears will probably need 5 – 10 bars before traders would conclude that the bears had taken control.
At the moment, the odds favor a pullback or trading range over the next 5 – 10 bars. If the bears get a reversal, this rally will be an early high. The bulls want a channel up. Most likely, the Emini will spend at least the next 5 bars deciding between these 2 outcomes. In addition, the odds favor a lot of sideways trading again today, despite the early rally.
Pre-Open market analysis
Last week was mostly in a tight trading range. Therefore the Emini is in breakout mode. The bulls want a strong breakout above 2500, but the bears want a close below the August 8 breakout high of 2486.75. While the breakout either way can come at any time, the Emini might wait for Wednesday’s FOMC announcement.
Possible gap up on weekly chart
If today gaps up above 2500 today, that would create a gap up on the weekly chart as well. The bulls would then try to rally this week and next to create consecutive bull trend bars. The bears, however, would try to have any gap up reverse either early today, or by the end of the week. They do not want consecutive bull trend bars after a gap up because that would increase the odds of at least 2 legs up.
Since the weekly and monthly charts are in buy climaxes, the gap will probably close within 2 – 3 weeks. This means that it would be an exhaustion gap instead of a measuring gap.
However, a buy climax and exhaustion usually results in a pause in a bull trend, not a trend reversal. Consequently, even if the Emini reverses down strong for several weeks after Wednesday’s FOMC announcement, the odds are that the selloff will be a bull flag on the weekly and monthly charts.
Overnight Emini Globex trading
The Emini is up 4 points in the Globex market. It is therefore 1 point above the 2500 Big Round Number. A small gap is more likely to close because it takes less effort from the bears to get below the breakout point. Furthermore, if the gap is small, it is more likely to close quickly, like in the 1st hour. It does not matter whether the Emini opens a little above or below the 2500 resistance. All that matters is whether it trends strongly up or down, or stays sideways.
Because a gap up and 2500 are important, there is an increased chance of a trend day up or down. The bulls want to keep the gap open. They therefore want an early rally. In addition, they want a rally in the final hour to create a strong bull trend day on the daily chart. The bears prefer an immediate strong reversal down on the open, and then a strong bear trend day. Alternatively, if there is an early rally, they will try to create a parabolic wedge top or a major trend reversal. This could create a reversal day.
While there is an increased chance of a trend day up or down, the odds still favor mostly trading range trading. This is because most days are mostly trading range days. Furthermore, Wednesday’s FOMC announcement is a catalyst. Markets usually enter trading ranges in the days before a catalyst. This is because traders know that a catalyst has a 50% chance of leading to a trend up or down. Therefore, they will not let the market become overbought or oversold going into the report.
Friday’s setups
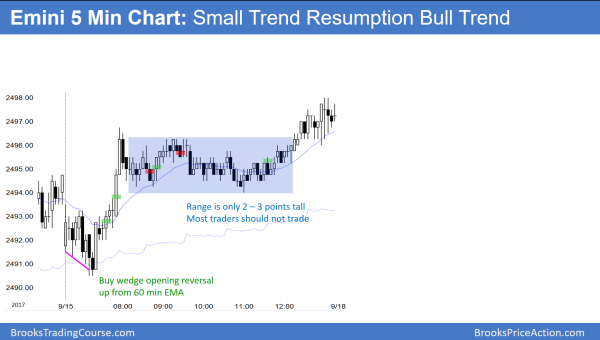
Here are several reasonable stop entry setups from Friday. I sometimes also show limit order entries and entries on the close of bars.
EURUSD Forex market trading strategies
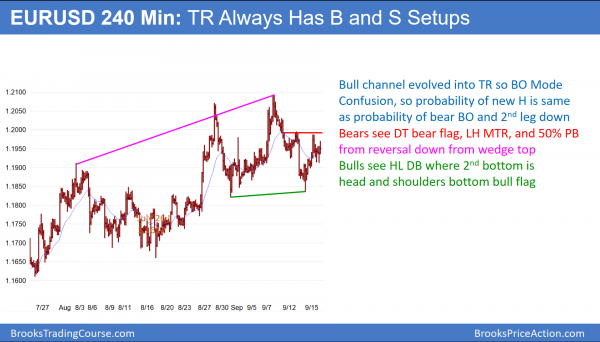
The 240 minute EURUSD chart has been sideways for 3 weeks after a wedge top. It therefore has both reasonable buy and sell setups and is in breakout mode.
The EURUSD 240 minute chart turned down from a wedge top last week. However, the 3 day rally retraced about 50% of the selloff. The wedge has evolved into a trading range, as expected. Since a trading range is neutral, the probability no longer favors the bulls. The chart is in breakout mode before Wednesday’s FOMC interest rate announcement. This means that traders are looking for a measured move up or down from the 3 week, 300 pip tall trading range.
Since the EURUSD monthly chart is at the resistance of the bottom of a 12 year trading range, the odds of a measured move up without a pullback on the monthly chart are only 40%. Consequently, if the bulls get a breakout above the high of 2 weeks ago, it will probably quickly fail.
The bears have a 60% chance of a test down to the August 17 low. This would be about a measured move down from the 3 week trading range. Furthermore, it is the beginning of the wedge, which is support and therefore a magnet.
Overnight EURUSD Forex trading
The 5 minute EURUSD chart has been in a 30 pip range for 4 hours. In addition, it is in the middle of a 3 week, 300 pip range. Finally, it is trying to be neutral going into Wednesday’s FOMC announcement. Consequently, the odds are against a big move up or down today. Therefore, day traders will be mostly looking for scalps. If there is a surprise strong breakout up or down, they will swing trade. However, the odds favor quiet trading into the report.
Summary of today’s S&P Emini futures price action and what to expect tomorrow
After gapping above 2500 and rallying, today reversed down and formed a reversal day and a doji day. Since it closed above its midpoint and open, it is a weak sell signal bar on the daily chart.
After today’s failed breakout above 2500, today reversed down. It is therefore a sell signal bar on the daily chart. Because it closed above its midpoint and the open, it is a weak sell signal bar. Since Wednesday’s FOMC announcement is an important catalyst and the Emini has had 6 bull bars, tomorrow will probably not be a strong bear day. Any big move up or down will probably come after Wednesday’s FOMC announcement.
See the weekly update for a discussion of the price action on the weekly candlestick chart and for what to expect going into next week.
Traders can see the end of the day bar-by-bar price action report by signing up for free at BrooksPriceAction.com. I talk about the detailed S&P Emini futures price action real-time throughout the day in the BrooksPriceAction.com trading room. We offer a 2 day free trial.
When I mention time, it is USA Pacific Standard Time (the Emini day session opens at 6:30 am PST, and closes at 1:15 pm PST). You can read background information on the intraday market reports on the Intraday Market Update page.


