Emini sell signal bar but minor reversal in bull flag
I will update again at the end of the day
Pre-Open market analysis
Yesterday was a bear reversal day. The odds are that the Emini daily chart is still forming a bull flag. However, if the bears get a couple big bear days, the odds will shift in favor of a bear leg down to the bottom of the 4 month range. Remember, I have been saying that the daily chart is in a trading range, despite the 8 day rally, and that therefore there is always at least a 40% chance of a break below the bottom of the range.
Since today is Friday, weekly support and resistance are important. The most significant price is the open of the week. If the bulls can get a close above the open, the candle stick on the weekly chart will have a bull body. It would then be a good follow-through candle stick after last week’s bull breakout.
The bears want the week to close near the low of the week. This week would then be a sell signal candle stick on the weekly chart for a failed breakout above the month-long triangle.
Overnight Emini Globex trading
The Emini is down 4 points in the Globex market. Since it is about 20 points below the open of the week, it might be too far below the open of the week to get there today. This week’s low is only about 14 points below and it is also a magnet for today. The bears want this week to close near its low today. That would create a bear reversal candle stick, which would be a sell signal bar for next week.
The targets above and below are not particularly far. Consequently, there is less need of a big trend day today. In addition, most of the trading over the past 5 days has been within trading ranges. Therefore, today will probably be another trading range day. It might have swings up and down like yesterday, but the odds of a big trend day up or down are less than normal.
Yesterday’s setups
Here are several reasonable stop entry setups from yesterday. I sometimes also show limit order entries and entries on the close of bars.
EURUSD Forex parabolic wedge sell climax is evolving into 300 pip tall trading range
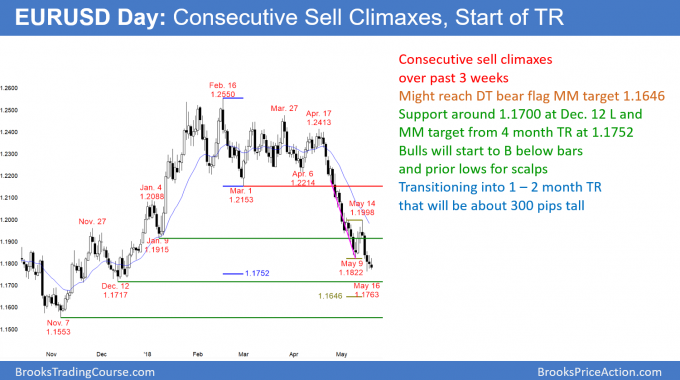
Yesterday was a doji inside bar on the EURUSD daily Forex chart. Since the trend is down, yesterday is a Low 1 bear flag and sell signal bar. However, after 4 weeks of sell climaxes, the chart will likely evolve into a trading range soon.
The EURUSD daily Forex chart has sold off for 4 weeks in a series of consecutive sell climaxes. That type of a bear trend typically evolves into a trading range. Therefore, the odds are that the daily chart will begin to probe for a bottom and then go sideways for at least a month.
The top of the most recent sell climax is the initial target for the top of the range. That is the May 14 high around 1.20. Support is around the December 12 low, which is approximately 1.17. Therefore the range will be about 300 pips tall.
Yesterday was a bear doji inside day and therefore a 1 day bear flag. Since the chart will probably soon evolve into a trading range, there might be more buyers than sellers below yesterday’s low and below Thursday low, which is the bottom of the most recent sell climax. The bulls will begin to get confident that the bears will become exhausted.
Exhausted bears prefer to sell pullbacks instead of at the low. They also switch from holding onto positions to taking profits below prior lows. Traders will watch over the next week to see if the daily chart starts to reverse up from below bars and begins to form bull bars. If so, those will be the earliest signs of the bear trend beginning to evolve into a trading range.
Outside down candle stick
This week traded above last week’s high and then below its low. Therefore, this week in an outside down week. While that is a sign of strong bears, it can also be a sign of exhaustion. Today’s close will provide traders with useful information. This is because it is the final day of the week and therefore affects the appearance of the weekly chart.
If today closes below last week’s low of 1.1822, the week will be more bearish. It would increase the chance of a test of support around 1.17 next week.
Alternatively, if today closes above last week’s low, it would represent profit taking by the bears. That would be a sign that the trend is losing momentum. It would therefore increase the chance of sideways prices next week.
For example, an inside week often follows an outside week. If next week is a bull inside bar, the weekly chart would have a bull ioi (inside-outside-inside) candle stick pattern. Hence it would be a minor buy signal bar, which would be an early sign of a bear trend transitioning into a trading range.
Overnight EURUSD Forex trading
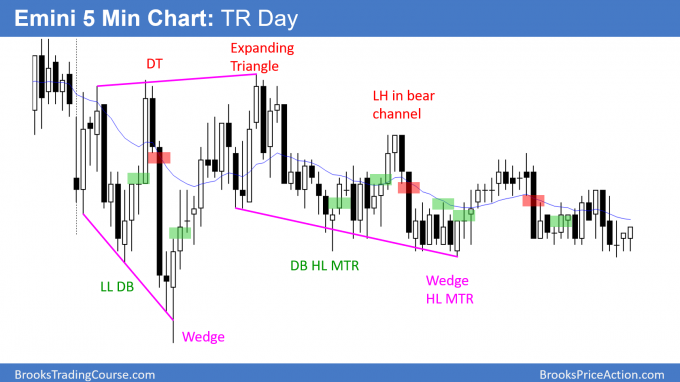
The EURUSD 5 minute Forex chart sold off 50 pips overnight after testing back above last week’s low. Since last week’s low is an important price today, there is an increased chance of a 50 pip reversal today to back above that low.
The bears have already achieved their goal of creating an outside down week. In addition, the daily chart has sell climaxes and therefore the bears are getting exhausted. Consequently, there is less chance of a big selloff from here today. As a result, the odds are that the 3 day trading range on the 5 minute chart will probably continue. But, there is an increased chance of a small bull reversal day today.
Summary of today’s S&P Emini futures price action and what to expect tomorrow
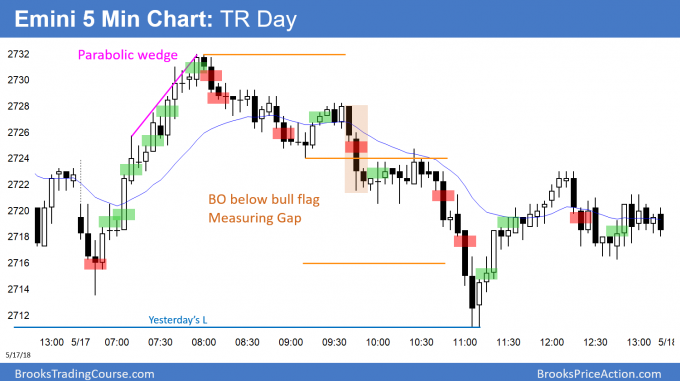
The Emini today was in a trading range today.
The Emini was in a small trading range day today. It was a sell entry bar on the daily chart. However, it was a weak entry bar and yesterday was a weak sell signal bar. It is still deciding whether the break above the April high will continue or reverse. Without big bear bars on the daily chart, the odds slightly favor the bulls.
Since this week was a bear bar on the weekly chart, it is a sell signal bar for next week. The bears want last week’s break above the 3 month triangle to fail. The odds on the weekly chart are also slightly better for the bulls.
See the weekly update for a discussion of the price action on the weekly candlestick chart and for what to expect going into next week.
Traders can see the end of the day bar-by-bar price action report by signing up for free at BrooksPriceAction.com. I talk about the detailed S&P Emini futures price action real-time throughout the day in the BrooksPriceAction.com trading room. We offer a 2 day free trial.
When I mention time, it is USA Pacific Standard Time (the Emini day session opens at 6:30 am PST, and closes at 1:15 pm PST). You can read background information on the intraday market reports on the Intraday Market Update page.


