Emini sell climax after Alphabet Google earnings
I will update again at the end of the day
Pre-Open market analysis
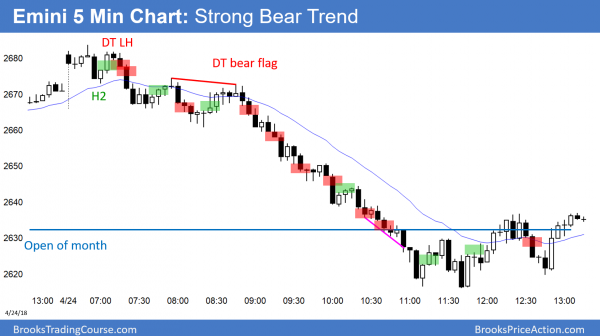
The Emini had a huge bear trend day yesterday. It traded below the open of the month. The bulls want the month to have bull body when it closes on Monday. However, this selloff was so strong that the odds are that the best the bulls will get is a bull doji on the monthly chart. They want a bull reversal bar, but that is not likely.
The bears want the month to close on its low. Yesterday was a Surprise Day, and therefore the odds are that there will be at least a small 2nd leg down within a week. Consequently, the bears will sell rallies over the next few days.
Because yesterday was a sell climax, there is a 75% chance of at least a couple hours of sideways to up trading today, beginning by the end of the 2nd hour. There is only a 25% chance of another big bear day.
Overnight Emini Globex trading
The Emini is down 8 points in the Globex market. It will therefore probably open within the 2 hour trading range from the end of yesterday. A sell climax day has a 50% chance of a strong selloff on the open. There is a 25% chance of a strong bear trend day.
The 2 hour trading range was late in a sell climax. Consequently, if there is a selloff today, that trading range will probably be the Final Bear Flag. That means that there will probably be buyers around yesterday’s low. They would likely create a reversal up back to the middle of the Final Flag.
The bulls hope that yesterday’s late higher low was a major trend reversal. They want a break above the 2 hour range and a 20 point measured move up to last week’s low. Alternatively, they will buy a selloff to around yesterday’s low and try to create a major trend reversal from that low.
Since yesterday was a sell climax in a 3 month trading range, the odds are that the bears will be disappointed by bad follow-through selling today. Therefore, today will probably be mostly sideways.
The open of the month was a magnet yesterday and the month closes on Monday. Therefore, the Emini might stay within 20 points of 2632 through Monday’s close.
Yesterday’s setups
Here are several reasonable stop entry setups from yesterday. I sometimes also show limit order entries and entries on the close of bars.
EURUSD head and shoulders top
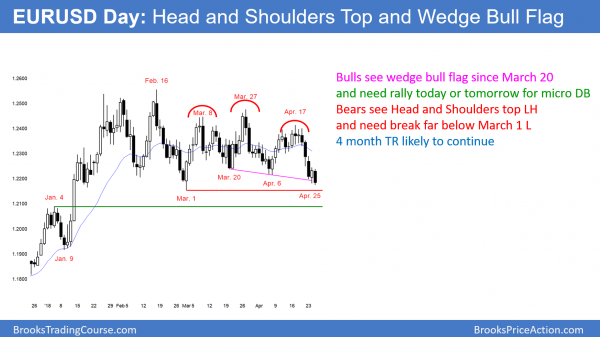
The EURUSD daily Forex chart has sold off from a head and shoulders top. But, most trend attempts within trading ranges fail. The bulls need a rally today or tomorrow to form a micro double bottom.
The EURUSD daily Forex chart has a wedge bull flag that began with the March 20 low. However, most reversals in the 4 month trading range began with micro double bottoms or tops. Consequently, the bulls need a reversal up today or tomorrow to create a micro double bottom.
Even if they get it, the momentum down in this leg is strong. Furthermore, the 1.2153 March 1 low is only 21 pips below the overnight low. Therefore, the odds are that the selloff will continue to below that low. The bulls would then try for a reversal up from below the 4 month trading range. That would be a High 2 buy setup where the High 1 bull flag was the March 1 low.
The bears have a head and shoulders top and good momentum down from the April 17 right shoulder. Only 40% of tops lead to bear trends. Therefore, the odds are that this selloff will reverse up from around the March 1 low.
However, if the bears get 2 consecutive bear bars closing below the March 1st low, the odds will shift in favor of a measured move down. The 4 month trading range is 400 pips tall. The target would therefore be around 1.1750, which is around the December 12 major higher low.
Other targets include prior highs and lows. The 1.2092 September 8 high and the 1.2088 January 4 high are breakout points and have never been tested. At the moment, there is a 50% chance that this selloff will fall below both. Below that is the 1.1915 January 9 bottom of the bull breakout.
Overnight EURUSD Forex trading
The EURUSD 5 minute Forex chart sold off overnight to below yesterday’s low. Because the bulls need a micro double bottom on the daily chart, they will try to create a reversal up today or tomorrow. Day traders will look for a reversal pattern or a strong reversal up today. Since the overnight selloff was strong, the odds are that the best the bulls will get today is a 50 pip bounce. They therefore will probably scalp.
The bears want the selloff to continue down to below the 1.2092 September high. While they prefer the selloff to go straight there, the odds are that it will stall today or tomorrow around the March 1 low. Consequently, they will look to sell rallies today. The odds favor a trading range today.
Summary of today’s S&P Emini futures price action and what to expect tomorrow
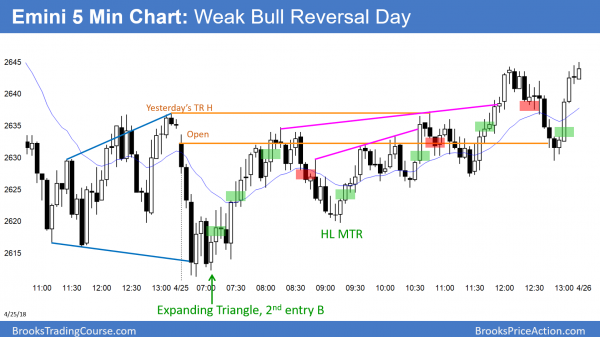
The Emini reversed up from an Expanding Triangle bottom after an opening sell climax. It rallied back above yesterday’s trading range and closed above the open. It was a weak bull reversal day.
The Emini had a weak bull reversal day. It therefore was the expected bad follow-through day after yesterday’s sell climax in a 3 month trading range. The day again oscillated around the open of the month. It may stay within 20 – 30 points of it until the Month ends on Monday. While the bears want trend resumption down tomorrow, the odds favor mostly sideways prices into Monday’s April close or Wednesday’s FOMC announcement.
See the weekly update for a discussion of the price action on the weekly candlestick chart and for what to expect going into next week.
Traders can see the end of the day bar-by-bar price action report by signing up for free at BrooksPriceAction.com. I talk about the detailed S&P Emini futures price action real-time throughout the day in the BrooksPriceAction.com trading room. We offer a 2 day free trial.
When I mention time, it is USA Pacific Standard Time (the Emini day session opens at 6:30 am PST, and closes at 1:15 pm PST). You can read background information on the intraday market reports on the Intraday Market Update page.


I hope you don’t mind if I chime in. First, all trades are risky. Also, remember what Al’s objective is in marking up these charts. Al is pointing out the “logical” stop entries that were available.
The trade in question was a logical entry. There was two failed attempts to break below yesterday’s low, and then a 3rd push down (functionally the same as a wedge) that couldn’t even go below the 7L or even let sell the close bears who sold the 6 close out at breakeven. The bull setup bar (B11) closed on it’s high and you have the target above, the open of the month.
I agree with that. Think about it this way. The 1st buy was strong. The bears then got a reasonable Low 2 bear flag. Since the sell signal bar was a doji, the the market was still Always In Long from a strong buy setup. Therefore, the bulls who exited had to buy again above the next bull bar if they are trading Always In. They did not like the bull bar to be big because that increases risk. In addition, they did not want to buy at the EMA because that reduces probability. However. in Always In Trading, buying was the only logical choice.
thanks Al and Alan
Hi Al,
what was your consideration on the 2nd buy (the bull breakout bar)? To me the price was at 50% pullback and under MA line and it was a risky buy
Thanks,
Alan