Trading Update: Friday December 3, 2021
Emini pre-open market analysis
Emini daily chart
- Yesterday was big bull bar after 2 big bear bars. The Emini is reversing up from sell climax.
- It reversed up from a 7-day micro wedge bottom and from a parabolic wedge bottom (November 23, November 26, December 1).
- The reversal was also from just below the September 2 high, which was the breakout point of the October rally. I have been saying that the Emini was likely to fall below that high.
- The reversal was also from below the November low. Remember, Wednesday triggered a monthly sell signal by trading below the November low, which was Tuesday’s low.
- The low was just below the 50-day MA and just above the 100-day MA, which are support.
- Yesterday is a buy signal bar for today.
- The bulls hope that the climactic selloff will lead to a rally. They want the year to close on the high, which would increase the chance of higher prices early next year.
- If the year closes on the high, the Emini will be above the November high. December would then be an outside up bar, increasing the chance of higher prices in January.
- If January were to gap up, there would be a rare gap on the yearly chart. I do not know if that has ever happened in the 100+ years of the S&P.
- The bears hope that any rally will form a lower high. They would then want the selloff to resume from a lower high major trend reversal.
- While the selloff has been strong, it was climactic. Yesterday reversed up from a cluster of support. That includes the 50- and 100-day moving averages, the September 2 high, the 4500 Big Round Number, and about a 50% retracement of the October rally.
- The strong selloff is good for the bears, but the big reversal from support is good for the bulls. That creates confusion, which usually results in a trading range.
- With yesterday’s range being big, there is an increased chance that today will be a 2nd consecutive inside bar. There would then be an ii (inside-inside), which is a Breakout Mode pattern. That means it would then be both a buy and sell signal bar.
- The bulls want strong follow-through buying today. If today is a big bull bar closing near its high, it will increase the chance of a December rally to a new all-time high.
- The bears want a bear bar closing near its low today or Monday. Or, they want any rally to reverse down from a good sell signal bar. They then hope that the selloff reverses the entire October rally.
- Today is Friday so weekly support and resistance can be important, especially in the final hour. The high and low of the week are probably too far to get there today. Therefore, the midpoint might be important.
- If the bulls get the week to close above its midpoint, it slightly increases the chance of higher prices next week.
- The bears want the week to close below the midpoint. Yesterday closed just slightly below that level.
- Since this week triggered a monthly sell signal, the bears would also like the week to close below the November low, which is just below yesterday’s close. Below that is the September 2 high, which is also a magnet below.
- What is most likely? With every selloff since the pandemic low, I have said the same thing. For most, I said the odds favored a quick resumption of the bull trend.
- In September 2020 and September 2021, I said the bears had a 50% chance of a 10% correction. But I also said that meant that the bulls had a 50% chance of a new high.
- At no time since the pandemic low have the bears had better than a 50% chance of a correction. That is true here as well.
- Unless the bears break strongly below the support, the odds will still favor the bulls. If the Emini begins to get some bull bars, traders will see the selloff as just a sell-vacuum test of support in a bull trend.
- We should find out next week. If next week remains unclear, the odds would begin to favor the Emini going sideways into the end of the year.
Emini 5-minute chart and what to expect today
- Emini is up 18 points in the overnight Globex session. It is testing the 4600 Big Round Number.
- If there is a gap up today, it will probably be small. Small gaps usually close in the 1st hour.
- While unlikely, today could be a 2nd consecutive inside day on the daily chart. Therefore, there might be an early reversal down from just below yesterday’s high.
- Today could be a bear day. But after yesterday’s strong reversal up on the daily chart from a sell climax at support, if today is a bear day, it will probably not be a strong bear day.
- Yesterday is a buy signal bar on daily chart for a micro wedge reversal up from 50-day MA. Bulls will try to get above yesterday’s high to trigger buy signal.
- If there are several early big bull bars, today could become a 2nd consecutive big bull day. That would increase the chance of a new high by the end of the year.
Yesterday’s Emini setups

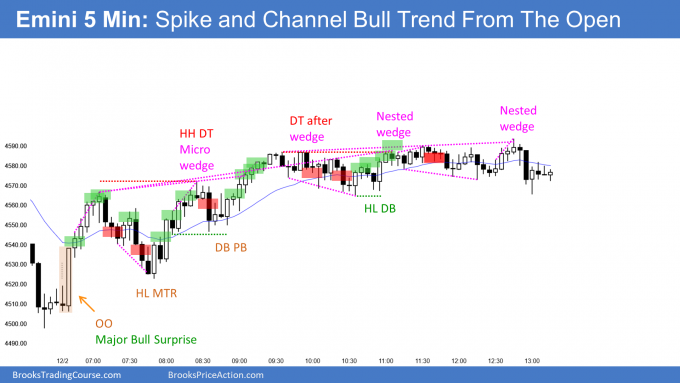
Here are several reasonable stop entry setups from yesterday. I show each buy entry with a green rectangle and each sell entry with a red rectangle. Buyers of both the Brooks Trading Course and Encyclopedia of Chart Patterns have access to a much more detailed explanation of the swing trades for each day (see Online Course/BTC Daily Setups).
My goal with these charts is to present an Always In perspective. If a trader was trying to be Always In or nearly Always In a position all day, and he was not currently in the market, these entries would be logical times for him to enter. These therefore are swing entries.
It is important to understand that most swing setups do not lead to swing trades. As soon as traders are disappointed, many exit. Those who exit prefer to get out with a small profit (scalp), but often have to exit with a small loss.
If the risk is too big for your account, you should wait for trades with less risk or trade an alternative market like the Micro Emini.
EURUSD Forex market trading strategies
EURUSD Forex daily chart

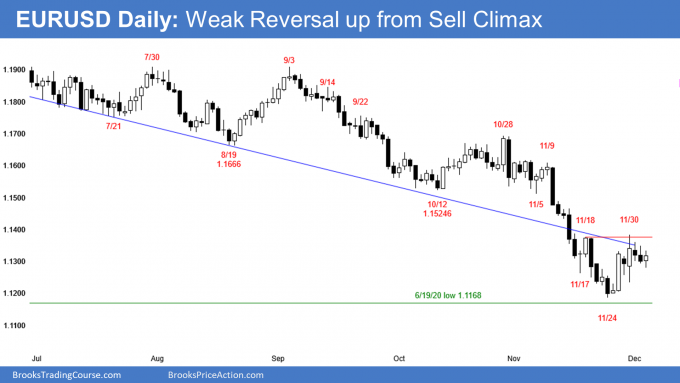
- Yesterday was the 2nd consecutive small bear day.
- By trading below Wednesday’s low, it triggered a Low 2 sell signal and a sell signal for a double top bear flag (November 18 and 30). The bears want the yearlong bear trend to continue. However, there should be a trading range lasting at least a couple months beginning soon since the EURUSD is in the middle of a 7-year trading range.
- Yesterday was a weak entry bar. It increases the chance that the 3-week trading range will continue.
- The bulls are hoping that the EURUSD is in a Small Pullback Bull Trend. If there is a breakout above the November 18 and November 30 double top, a measured move up would be back to near the bottom of the yearlong trading range.
- A strong breakout would likely be the start of a couple months of sideways to up trading.
- Today is the last day of the week. Weekly support and resistance can be important, especially at the end of the day.
- This week triggered a buy signal on the weekly chart after a sell climax. However, this week so far is a doji bar.
- The bulls want the week to close on its high and far above last week’s high. That is unlikely after 2 small days.
- At a minimum, they want the week to close above the open. If there is a bull body on the weekly chart, it would increase the chance of sideways to up trading next week. The bigger the body, the more likely next week will be high.
- This week was a bounce in a bear trend. It is a Low 1 sell signal bar for next week.
- The bears want the week to close near its low. The bigger the bear body, the more likely next week will continue down. If there is a small bear body (or small bull body), next week will probably be sideways.
- Since the EURUSD is in the middle of a 3-week trading range, it is more likely to continue sideways for at least a few more days.
- However, the strong bear trend can resume at any time, and the extreme sell climax can lead to a sharp reversal up at any time.
- It is important to remember that the entire 2021 selloff is still in the middle of a 7-year trading range. The EURUSD is therefore more likely to begin to go sideways for at least a couple months before it breaks below the trading range low, if is going to break below within the next year.
- It may trade lower for a few weeks, but it should begin to form a trading range soon.
- The top of the range might be around the bottom of the September 2020 to September 2021 trading range at around 1.16.
Summary of today’s S&P Emini futures price action and what to expect tomorrow

End of day summary
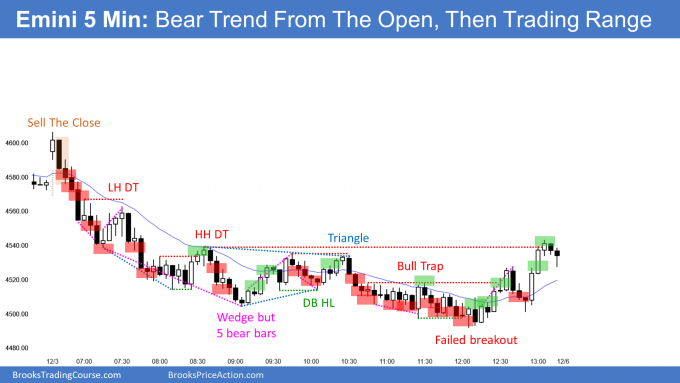
- Today was a Bear Trend From The Open, but there was a late reversal into the close.
- It reversed down from above yesterday’s high to below yesterday’s low, which is an outside down day. That increases the chance of lower prices next week.
- Bulls wanted a reversal up from a failed breakout below Wednesday’s 7-day micro wedge, and from a micro double bottom with Wednesday’s low.
- Bears want a successful breakout below the micro wedge and then a measured move down from the all-time high. That would be a test of the October low and a 10% correction.
- The more big bear bars, the more likely the Emini will continue down to the October low and the less likely it will resume up to a new high before the end of the year.
- The probability is almost 50% that the bears will get the test of the October low before there is a new high. But if next week sells off, the selloff will probably continue down to the October low.
- The Emini is about equally distant from both targets.
- However, that also means a new high is still slightly more likely. It will be significantly more likely if there are a few bull bars next week.
See the weekly update for a discussion of the price action on the weekly chart and for what to expect going into next week.
Trading Room
Traders can see the end of the day bar-by-bar price action report by signing up for free at BrooksPriceAction.com. I talk about the detailed S&P Emini futures price action real-time throughout the day in the BrooksPriceAction.com trading room. We offer a 2 day free trial.
Charts use Pacific Time
When I mention time, it is USA Pacific Time. The Emini day session charts begin at 6:30 am PT and end at 1:15 pm PT which is 15 minutes after the NYSE closes. You can read background information on the market reports on the Market Update page.


sir is it possible to automate or use algorithm to take price action based trades if so what are the common strategies we can automate?
Hi Kamala,
Yes, there are sophisticated traders out there that do that but you are talking about very complex programming. Many institutions hire physics, math, and other PhDs to do this kind of work.
IMHO, for independent traders like us, best to not waste time and money on such work and just trade what is in front of you.
Ask this question in the support forum to hear others’ views. Some out there are no doubt working on this. But be very wary of anyone trying to sell you an automated system. If it was that good, why sell it?
sure, thanks for reply.