Trading Update: Wednesday January 5, 2022
Emini pre-open market analysis
Emini daily chart
- Yesterday was a bear day and a reversal down from a new high. Emini rally pausing with a sell signal bar for today. However, it closed in the middle of its range and in the middle of a 6-day tight trading range. There will probably be more buyers than sellers below yesterday’s low.
- There is a micro double top with the December 30 high and a wedge top with the September 2 and November 22 highs.
- It is important to note that the late December rally was strong. A reversal down at this point should be minor.
- If there is follow-through selling today, it should be a pullback in the bull trend and not a trend reversal. The bulls will buy any 2- to 3-day selloff.
- What about the wedge on the daily chart? The October rally was so strong that it might have reset the count. Therefore, the November 22 high might be a new 1st leg up in what will become a wedge.
- While the rally from the October low will probably eventually lead to a wedge top and then a reversal down to the December 3 or October 4 low in the spring or summer, traders should expect higher prices for at least another month or two.
- Magnets above are the top of the bull channel (currently around 4850) and the 5,000 Big Round Number.
- The monthly chart is having a 3rd push up since the September high. That micro wedge will usually attract profit takers, and it should lead to a 2-month pullback beginning within a couple months.
- However, the bull trend on the monthly chart has been very strong. Therefore, even if there is a sharp selloff down to the October low in the 1st half of this year, it should be minor.
- The best the bears will probably get on the monthly chart is a trading range for many months. A trading range in a bull trend is usually a bull flag. Therefore, traders should expect a bull breakout of the trading range later in the year.
- The gap up in April 2020 could lead to a measured move up to 5,801.5 before the bull trend finally ends.
- I plan to create a video later this week about the yearly and monthly charts.
Emini 5-minute chart and what to expect today
- Emini is down 1 point in the overnight Globex session.
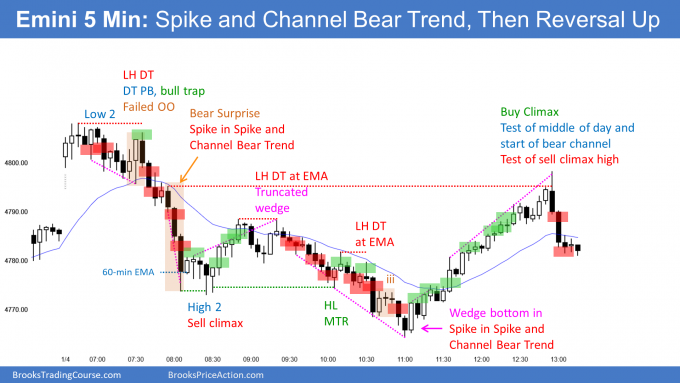
- Yesterday was a Spike and Channel Bear Trend day. In the 2nd half of the day, the Emini rallied up to the start of the bear channel, which is typical.
- Yesterday’s strong reversal up from its sell climax day reduces the chance of a big bear day today.
- Yesterday was a Big Down, Big Up day. That creates Big Confusion and usually leads to a trading range.
- A Spike and Channel Trend typically leads to a trading range and yesterday’s late rally might be the start.
- Also, yesterday closed in the middle of a 6-day tight trading range. That increases the chance of more sideways trading.
Yesterday’s Emini setups

Here are several reasonable stop entry setups from yesterday. I show each buy entry with a green rectangle and each sell entry with a red rectangle. Buyers of both the Brooks Trading Course and Encyclopedia of Chart Patterns have access to a much more detailed explanation of the swing trades for each day (see Online Course/BTC Daily Setups).
My goal with these charts is to present an Always In perspective. If a trader was trying to be Always In or nearly Always In a position all day, and he was not currently in the market, these entries would be logical times for him to enter. These therefore are swing entries.
It is important to understand that most swing setups do not lead to swing trades. As soon as traders are disappointed, many exit. Those who exit prefer to get out with a small profit (scalp), but often have to exit with a small loss.
If the risk is too big for your account, you should wait for trades with less risk or trade an alternative market like the Micro Emini.
EURUSD Forex market trading strategies
EURUSD Forex daily chart

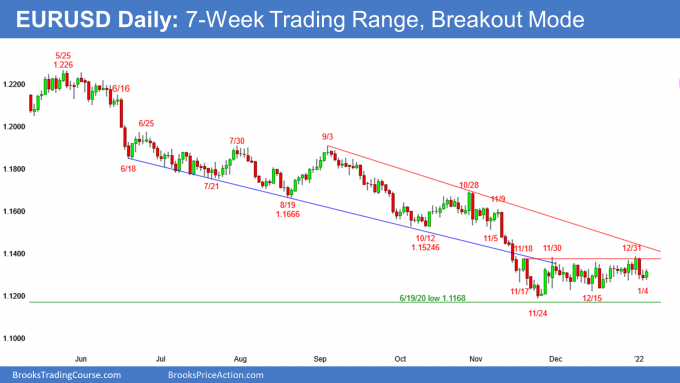
- Tight trading range for 7 weeks so Breakout Mode. Since it is in a bear trend, bear breakout is slightly more likely than bull breakout.
- In November, EURUSD had a sell climax that broke far below bear channel.
- Currently, getting near top of channel by going sideways instead of up. Traders might wait for EURUSD to reach bear trend line (top of channel) before either breaking above and starting a rally, or reversing down for another leg in the bear trend.
- But if there is a bear breakout, a tight trading range late in a trend is usually the Final Flag. Therefore, there will probably be a reversal up after about a measured move down.
- Less likely, the yearlong bear trend will continue down to below the bottom of the 7-year trading range on the monthly chart without at least a 2- to 3-month bounce.
- As strong as the bear trend has been on the daily chart, it is still more likely a pullback from the 2020 rally on the monthly chart (not shown). The lack of consecutive big bear candlesticks on the monthly chart over the past year makes this selloff more likely a leg in the 7-year trading range than a resumption of the bear trend that began in 2008.
- Traders therefore should expect at least a couple months of sideways to up trading to begin within the next couple months. The bulls hope there is a breakout above the 7-week trading range and yearlong bear channel and then a rally for 2 to 3 months.
- Trend reversals in the Forex markets have an increased chance of forming just after the start of the year. The current bear trend began on January 6 of last year. Therefore, there is an increased chance of a rally starting in the next few weeks.
- However, it is slightly more likely to begin after one more brief leg down to below the June 19, 2020 higher low.
- In this 7-week tight trading range, traders are buying near the bottom and selling near the top. They are taking quick profits, betting on continued reversals every day or two.
Summary of today’s S&P Emini futures price action and what to expect tomorrow

End of day summary
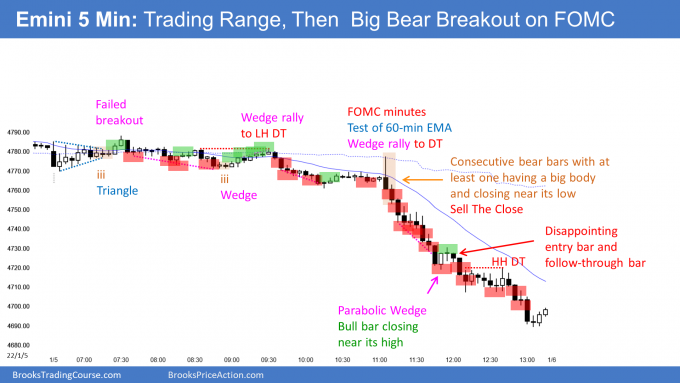
- Today was a trading range until the FOMC minutes at 11 am PT.
- There was a sharp rally to the 60-minute EMA and then a strong reversal down.
- I have said a few times that the Emini probably had to dip below the December 16 high, which it did today. That is because the rally on the daily chart is a possible wedge. Pullbacks typically fall below the prior high, which was the December 16 high.
- The bears are hoping that the current wedge top reversal on the daily chart is the start of a move down to the December and October lows. But they will need at least a couple more bear days before that becomes likely.
- More likely, this strong selloff is just a pullback in the bull trend.
- Because today was a Bear Surprise Bar on the daily chart, there should be at least a small 2nd leg sideways to down within a few days. Most bulls will want a micro double bottom before looking for the bull trend to resume.
- Since today was an extreme sell climax day, there is a 70% chance that tomorrow will have at least a couple hours of sideways to up trading that starts by the end of the 2nd hour.
See the weekly update for a discussion of the price action on the weekly chart and for what to expect going into next week.
Trading Room
Traders can see the end of the day bar-by-bar price action report by signing up for free at BrooksPriceAction.com. I talk about the detailed S&P Emini futures price action real-time throughout the day in the BrooksPriceAction.com trading room. We offer a 2 day free trial.
Charts use Pacific Time
When I mention time, it is USA Pacific Time. The Emini day session charts begin at 6:30 am PT and end at 1:15 pm PT which is 15 minutes after the NYSE closes. You can read background information on the market reports on the Market Update page.


Dear Al,
Is ii bar 70 a reasonable exit of short and start of buying for possible last-hour bull reversal?
It indeed has the bear body but closed above the half of the bar. It also occurred after possible parabolic wedge (59-64-68) at around EMA of daily chart.
Thank you and Happy New Year to you and your family. Wishing you the best you wish throughout the year.
It was reasonable to exit shorts above the ii, but when buying in a strong bear trend, it is better to only buy if there is a very strong buy signal bar (bull bar with a big body and closing near its high). That did not happen after the ii. The bears would sell again below the low 2 a few bars later.
Thanks for the report. Wondering if the move down yesterday is a result and a follow through from the 60 minutes bear surprise bar from Tuesday open (bull give up bar) wherbuy we typically expect 2nd leg down an MM accordingly which seems we have achieved based on that. More importantly to understand when you prepare yourself for trading what level of weight and attention you give to that?
In hindsight, that bar was the first leg down in what is a trend reversal on the 60-min chart. This selloff is the follow-through. It might end up as a parabolic wedge sell climax.
Happy new year Al.
How long do you spend analyzing the charts every day when the market is closed?
During live markets can we have enough time to segregate the market movements as you do during market charts?
I realized that during live markets if we make a few decisions it will reduce the errors or I feel we cannot frequently make the right decisions.
Please share your view, sir.
I spend at least 30 min every night creating charts. That is my practice and it helps me quickly identify just about everything real-time when I am trading.