Emini rally hesitating at April high during Israel embassy crisis
I will update again at the end of the day
Pre-Open market analysis
The Emini daily chart had an 8 bar rally with shrinking bull bodies for 4 days. The odds were that yesterday would not be a bull trend day. It was a trading range day.
The bears see yesterday as a sell signal bar on the daily chart for a failed breakout above the April high. The bears today will probably get a break below yesterday’s low to trigger a minor reversal down. While a 1 – 3 day pullback is likely, a reversal into a bear trend is is not. The bears need several big bear days to retake control.
Despite the strong rally, the bears still have a 40% chance of a break below the 4 month range until the bulls get a much stronger reversal up. This is because the daily chart is in a trading range. Trading ranges constantly form strong legs up and down. But, most breakout attempts fail. Until there is a breakout, there is no breakout. The momentum up over the past 2 weeks favors the bulls. However, they cannot have more than a 60% chance of a bull trend while the Emini is still in a trading range.
Overnight Emini Globex trading
The Emini is down 16 points in the Globex session. It will likely trade below yesterday’s low and therefore trigger a sell signal on the daily chart. Since the daily chart is in a trading range, the size or duration of the selloff will disappoint the bulls. An obvious way to do that is for the selloff to fall back below the April 18 high of 2718.00. That is the breakout point.
However, after an 8 day strong rally, the selling will probably last only 1 – 3 days before the bulls will buy again. If the selloff is strong, then a trading range for a few days will be likely. If the selling is weak, the bulls will probably get back above yesterday’s high this week.
But, the rally has been climactic. There is therefore an increased chance of a big bear trend day today. In addition, the bull climax at the resistance of the April high will probably lead to a few days of sideways trading.
Yesterday’s setups
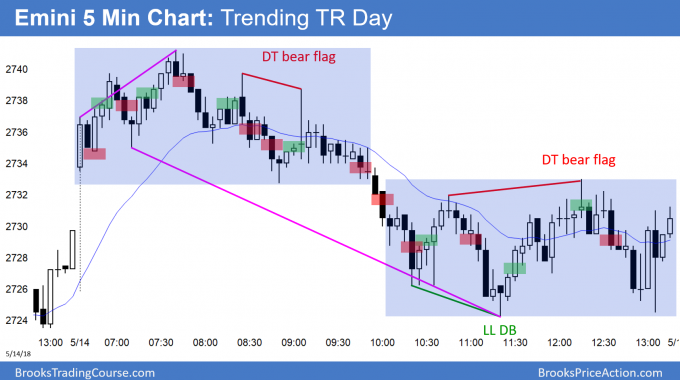
Here are several reasonable stop entry setups from yesterday. I sometimes also show limit order entries and entries on the close of bars.
EURUSD Forex market trading range between 1.18 and 1.20 after parabolic wedge sell climax
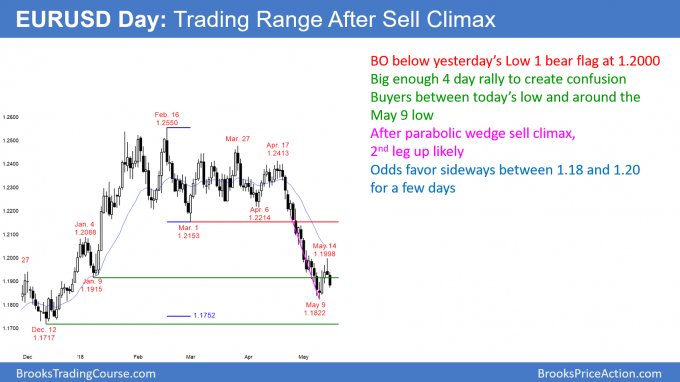
The EURUSD daily Forex chart sold off sharply over the past 2 days. Yesterday was a Low 1 sell signal bar at the resistance of the 1.20 Big Round Number. The 200 pip rally was big enough to create confusion. The odds are that the chart will go sideways for a few days.
The EURUSD daily Forex chart rallied 200 pips to 1.2000. I wrote several times over the past week that the bears would sell there. I also have been saying that the selloff was extreme and climactic. Therefore, the odds favor a pause, and at least 2 legs sideways to up. The 3 day rally was strong enough to make a 2nd leg sideways to up likely. Consequently, the 2 day selloff will probably find buyers between today’s low to around last week’s low. Therefore, even if the bear trend resumption falls below last week’s low, there will probably be buyers below around 1.18. The bears will take profits and the bulls will buy, betting on a trading range after the sell climax.
The next support below last week’s low is the December 12 low of 1.1717. If today’s selloff continues to that level over the next few days, the odds favor at 200 – 300 pip rally from there.
Can the daily chart continue down to the November 7 low of 1.1553 without another bounce? That is unlikely because the parabolic wedge sell climax is telling us that the bears are probably exhausted. Therefore a trading range between 1.18 and 1.20 is likely over the next few weeks.
Overnight EURUSD Forex trading
The EURUSD 5 minute Forex chart has sold off 90 pips overnight. The selling over the past 2 hours has been very strong. It is therefore climactic. A sell climax usually means that the bears are exhausted. They therefore usually take profits and wait for at least 10 bars before selling again.
Ten bars is about an hour. Even if the bears sell again after a 1 hour 20 – 30 pip bounce, there is support at last week’s low and the 1.18 Big Round Number. Therefore, the bulls will begin to look for reversals. Since a bull trend is unlikely immediately after a strong bear breakout, the bulls will scalp for 10 – 20 pips.
Since the bears know that this selling is climactic, they will soon take profits. Because a 2 – 3 hour trading range is then likely, they will sell 20 – 30 pip rallies to around the the 20 bar EMA for 10 – 30 pip scalps.
Summary of today’s S&P Emini futures price action and what to expect tomorrow
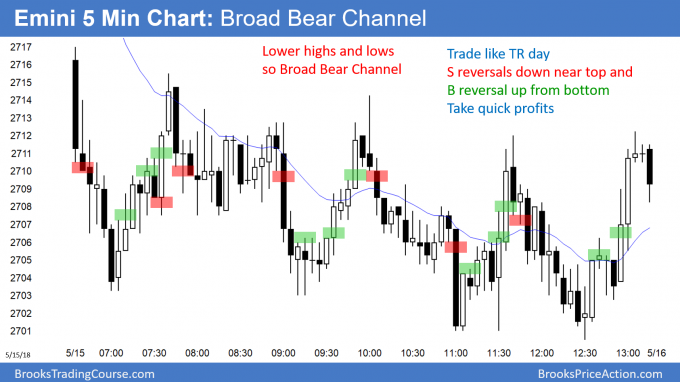
The Emini sold off in a broad bear channel today.
By trading below yesterday’s low, the Emini triggered a sell signal on the daily chart. However, the 8 day rally was strong. Therefore, this 2 day selloff is more likely going to be a bull flag than a bear trend. The bears need follow-through selling over the next few days if they are going to convert this bull flag into a bear trend.
See the weekly update for a discussion of the price action on the weekly candlestick chart and for what to expect going into next week.
Traders can see the end of the day bar-by-bar price action report by signing up for free at BrooksPriceAction.com. I talk about the detailed S&P Emini futures price action real-time throughout the day in the BrooksPriceAction.com trading room. We offer a 2 day free trial.
When I mention time, it is USA Pacific Standard Time (the Emini day session opens at 6:30 am PST, and closes at 1:15 pm PST). You can read background information on the intraday market reports on the Intraday Market Update page.


Hi Al,
I was just wondering what setup you have for the bars on your software. Because for me, bar 18 had a bull body and bar 19 had a bear body! You had the opposite on your chart.
That is usually due to sampled data, which most brokers use. They do not show every tick because it would slow their computers and yours as well. You can always get the actual 5 minute chart at the CME website.
There’s a 10 min delay on those charts, unless I cannot find the source you are talking about. I’m just wondering will it have much effect on my trading choices in the long run, I get everyone’s charts on every computer look slightly different but I wonder how often there may be signal bars that look good on one chart and not the other.
I would not worry about it because if a bar is a doji, it rarely matters if it has a small bull or bear body. Strong bull or bear bars will look right, even with sampled data.
This is the link to the CME, which also shows delayed, but perfect, data:
http://www.cmegroup.com/trading/equity-index/us-index/e-mini-sandp500.html
thanks Al!
Al,
On your charts with suggested stop entries the buys almost always follow signal bars with at least a small bull body, and vice versa for sells. Yesterday I took the late day DT bear flag short, but shorted beneath a signal bar with a bull body. It worked, but I wondered how strict you like to be in terms of taking stop entries with signal bar bodies that align with the direction of your trade.
Thanks.
Dave
I think most traders should buy with stops above bull bars and sell with stops below bear bars. IT is better if the buy signal bars close near their highs and the sell signal bars close near their lows. I try to illustrate that with these charts. Look back at any of the charts and you will see that it is a sensible strategy.