Emini pullback from parabolic wedge top on 60 minute chart
I will update again at the end of the day.
Pre-Open market analysis
The Emini had another trading range day yesterday. Its high was below Tuesday high, and therefore yesterday is a High 1 bull flag. But, yesterday had a bear body and is therefore a weak buy signal bar.
In addition, the 60 minute chart still has a parabolic wedge top at a measured move target. Hence, the odds favor at least a little more pullback before the bull trend resumes. This is true even if today trades above yesterday’s high.
A major reversal down is unlikely to begin within the next few days. More likely, there will be a test of the all-time high within a few weeks. There is a 30% chance of it coming within a week.
Overnight Emini Globex trading
The Emini is up 3 points in the Globex market. After the parabolic wedge rally to a measured move target on the 60 minute chart, the odds favor a longer pullback. In addition, the past 2 days were trading range days. That increases the odds for another one today.
Furthermore, Tuesday’s triangle on the 5 minute chart is a magnet below. Other important magnets below are the 60 minute EMA and the July 25 high, which is a breakout point. All are around the 2850 Big Round Number. Therefore, day traders will look to sell rallies. This is true even if today goes above yesterday’s high.
Once the pullback reaches that support around 2850, the bulls will begin to look for a reversal up. That could lead to one or more bull trend days and a resumption of the rally up to a new all-time high.
Can the 60 minute parabolic wedge top lead to a bear trend reversal down to last week’s low at around 2800? Yes, but there is a 70% chance of another leg up to at least a little above Tuesday’s high 1st.
Yesterday’s setups
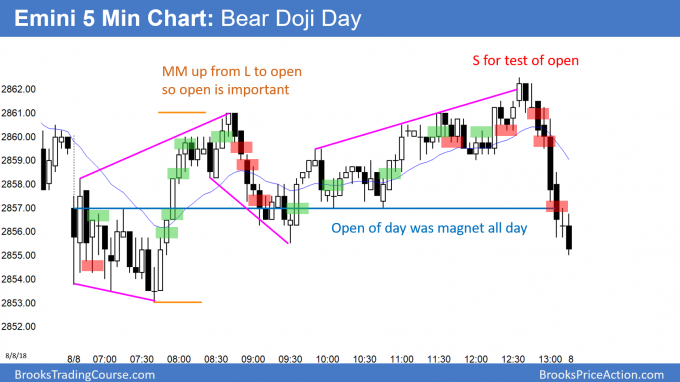
Here are several reasonable stop entry setups from yesterday. I sometimes also show limit order entries and entries on the close of bars. My goal with these charts is to present an Always In perspective. If a trader was trying to be Always In or nearly Always In a position all day, and he was not in a position at the moment, these entries would be logical times for him to enter.
EURUSD Forex Low 1 bear flag will probably grow into Low 2
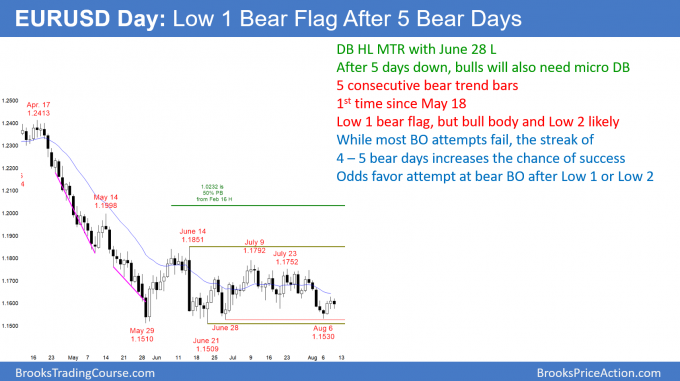
The EURUSD daily Forex chart rallied for 2 days from a double bottom with the June 28 low. However, after 5 bear bars, the bulls will need a micro double bottom. Furthermore, the odds now favor a break below the June low after a micro double top bear flag.
The EURUSD daily Forex chart had 5 consecutive bear trend bars. While they were not big, that is the longest streak up or down in the 3 month trading range. Charts have 2 variables, price and time. Sometimes, time is more important. This selling pressure now makes a bear breakout likely within a couple of weeks.
Yesterday is a Low 1 bear flag, but it was a bull bar and the 5 bear bars were not all big. Therefore, the bears will probably need 2 failed small rally attempts before they can get their breakout. The odds are the daily chart will trade down for a day or two and bounce from a micro double bottom. Then, the bears will try for their breakout after a micro double top (Low 2) bear flag. This means that the daily chart will probably be in a tight range for several more days.
Overnight EURUSD Forex trading
The EURUSD 5 minute Forex chart is in the middle of a 45 pip overnight trading range. In addition, it is probably also in the middle of a 100 pip tall tight trading range that will last several more days. Day traders will look to buy reversals up from below the prior day’s low and sell reversals down from above the prior day’s high. In addition, they will trade any small reversal on the 5 minute chart and be quick to take profits.
There is a 60% chance of a bear breakout on the daily chart and a 40% chance of a strong reversal up. Either would require a strong trend on the 5 minute chart. But, neither is likely for at least a few days.
Summary of today’s S&P Emini futures price action and what to expect tomorrow
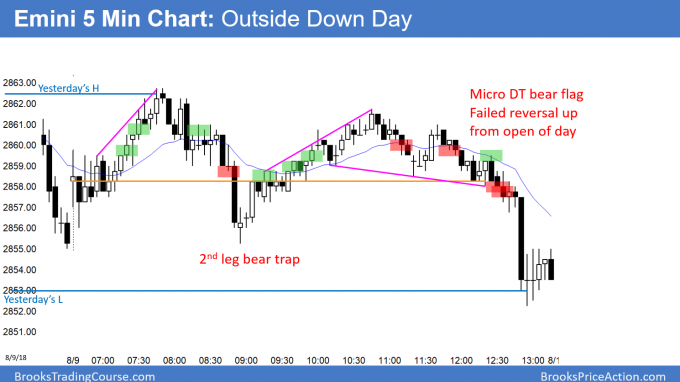
Here are several reasonable stop entry setups for today. I sometimes also show limit order entries and entries on the close of bars. My goal with these charts is to present an Always In perspective. If a trader was trying to be Always In or nearly Always In a position all day, and he was not in a position at the moment, these entries would be logical times for him to enter.
The Emini sold off from above yesterday’s high, but rallied off the 60 minute EMA. Late in the day, it traded below yesterday’s low and became an outside down day. There is now a micro double top.
The parabolic wedge rally to resistance on the 60 minute chart will probably limit any rally over the next few days. The odds still favor a test down to Tuesday’s triangle at around 2850, even if there is a new high 1st.
If tomorrow gaps down, there will be a 3 day island top. This could lead to a deeper pullback, but the odds still favor a new high within a couple of months.
See the weekly update for a discussion of the price action on the weekly candlestick chart and for what to expect going into next week.
Traders can see the end of the day bar-by-bar price action report by signing up for free at BrooksPriceAction.com. I talk about the detailed S&P Emini futures price action real-time throughout the day in the BrooksPriceAction.com trading room. We offer a 2 day free trial.
When I mention time, it is USA Pacific Standard Time (the Emini day session opens at 6:30 am PST, and closes at 1:15 pm PST). You can read background information on the intraday market reports on the Intraday Market Update page.


