Emini pullback in bull trend despite Italy financial crisis
I will update again at the end of the day
Pre-Open market analysis
After Wednesday’s strong reversal up, yesterday had a weak selloff. It is therefore more likely a pullback from Wednesday’s rally than a bear reversal.
Yesterday was the last day of the month. While May was a good bull bar on the monthly chart, the bulls failed to close the month above April’s high. That is a sign that the bulls are not as strong as they could be. Yet, the odds are that the bull trend resumed on May 3. Unless the bears get consecutive big bear trend days, the odds favor a new high this summer.
Overnight Emini Globex trading
Today is Friday and therefore today’ close affects the weekly chart. Since the week so far is a doji bar on the weekly chart, today might close near the 2701.00 open of the week. If it closes near the high, this week will be a good buy signal bar on the weekly chart. Therefore, today will probably be sideways or up. Less likely, it will sell off to the low of the week.
Yesterday’s setups
No chart from yesterday because I did not trade.
EURUSD Forex market trading strategies
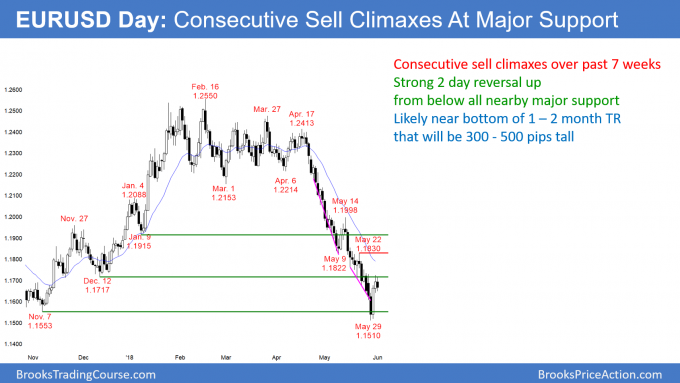
EURUSD daily Forex chart has exhausted bears at major support
The EURUSD daily Forex chart had extreme selling down to major support. It led to a very big bull bar and a bull follow-through bar. This tells traders that there is a 70% chance that the selling is over for at least a month. Bulls will begin to buy below the prior day’s low. Also, they buy below Monday’s very big bull bar. In addition, the bears will now switch to selling rallies instead of at the market. The result will be a trading for at least a month.
Furthermore, the bottom of the range will be around this week’s low and the 1.1500 Big Round Number. The top of the range will be around the top of a recent sell climax. Therefore, 1.18 and 1.20 are magnets over the next several months.
Overnight EURUSD Forex trading
The EURUSD daily Forex chart will probably enter a fairly tight trading range for several days. Consequently, the 5 minute chart will have lots of reversals. Therefore, day traders will mostly scalp for at least a couple of weeks. The overnight legs are big enough for 20 – 30 pip scalps. But, it will shrink and traders will soon switch to 10 pip scalps.
Summary of today’s S&P Emini futures price action and what to expect tomorrow
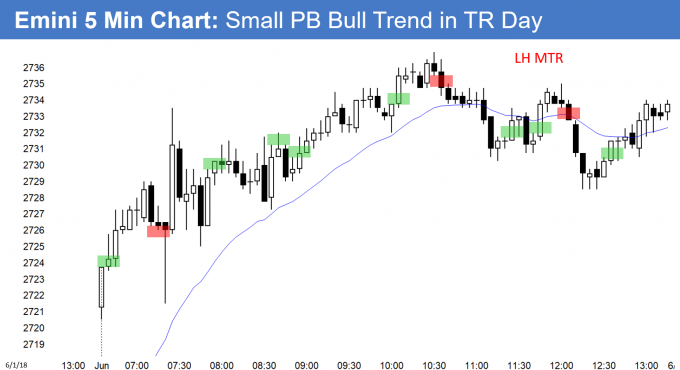
Today had s Small Pullback Bull Swing, but not a bull trend. While it closed above the open, it was mostly a trading range day.
This week closed near its high. In addition, it was the 3rd week of a pullback from a breakout above a triangle on the weekly chart. It therefore is a buy signal bar on the weekly chart for next week. The context is good for the bulls. Therefore, next week probably has to trade above this week’s high to see if there are more buyers or sellers there.
There is an increased chance of a big bull bar on the weekly chart. However, the weekly chart has been in a trading range for 4 months. Consequently, it is more likely that next week will disappoint the bulls and not be a big bull trend bar.
See the weekly update for a discussion of the price action on the weekly candlestick chart and for what to expect going into next week.
Traders can see the end of the day bar-by-bar price action report by signing up for free at BrooksPriceAction.com. I talk about the detailed S&P Emini futures price action real-time throughout the day in the BrooksPriceAction.com trading room. We offer a 2 day free trial.
When I mention time, it is USA Pacific Standard Time (the Emini day session opens at 6:30 am PST, and closes at 1:15 pm PST). You can read background information on the intraday market reports on the Intraday Market Update page.


Al, Why would bar 8 on today’s chart be a sell? It was the 1st push down in a tight bull channel (L1). Is it that a large reversal bar in the 1st hour of trading and OK to take an L1?
Thank you in advance.
I’d like to take a stab at an answer if you don’t mind. At bar 8 the market is clearly always in long. Al says that the first trend of the day has a 50% chance of reversing, no matter how strong. If you are shorting in an always in long market, you are most likely to be scalping. There was plenty of follow through for a scalp on this short, with a probability of at least 50%. The sell signal bar was strong, opening near its high and closing near its low. It was also a bear outside bar (and a bearish engulfing pattern). The price was also well above the moving average with a good chance the bears would probably try to close the gap. Sorry- I couldn’t resist.
I agree. The odds were good that there were buyers below after an 8 bar bull micro channel. However, there was a micro parabolic top, and with that strong sell signal bar, the odds favored at least a test down. Some traders do not sell below the 1st bear bar. However, they do sell below the 2nd bar (the entry bar) if it has a bear body because that increases the chance of a reversal down to the low and to the EMA. In the chat room during the rally, I said that the bullish price action was not strong enough for traders to buy that high above the average price and therefore the odds favored a test to near the EMA, which could form a double bottom.