Emini pullback from breakout above April high and triangle
I will update again at the end of the day
Pre-Open market analysis
The Emini 5 minute chart reversed down on Friday after breaking above the April high. When there is a breakout on the daily chart, the Emini often goes sideways for a few days as it decides whether to continue up or reverse. At the moment, the 6 day rally makes higher prices likely. This is true even if there is a pullback for a few days.
But, if the bears get consecutive big bear days early this week, the breakout will probably fail. As strong as the rally has been, it is still in a trading range on the daily chart. As long as the Emini is in a trading range on the daily chart, there is always at least a 40% chance that any rally is a bull trap and will lead to a breakout below the 4 month range.
If the bull trend on the daily chart is resuming, the bulls can keep creating a long series of bull trend days. It is more likely that the rally will look like a bull leg in a 4 month trading range rather than in a strong bull trend. While the odds are that the low is in, the rally will probably have several pullbacks along the way. Since the 7 day rally is a lot for a leg in a trading range, the odds favor a pullback today or tomorrow.
Overnight Emini Globex trading
The Emini is up 4 points in the Globex market. Since the daily chart is in a trading range and just above the resistance of the April 18 lower high, the odds are that the bulls will be disappointed by a lack of strong follow-through buying today or tomorrow. Consequently, the bulls will begin to look to buy pullbacks and take profits at new highs.
The bears will do the opposite. They will look to sell above prior highs and on reversals down, and take profits near prior lows. With both the bulls and bears buying low, selling high, and taking quick profits, the result will probably be a trading range for at least a couple of days.
Friday’s setups
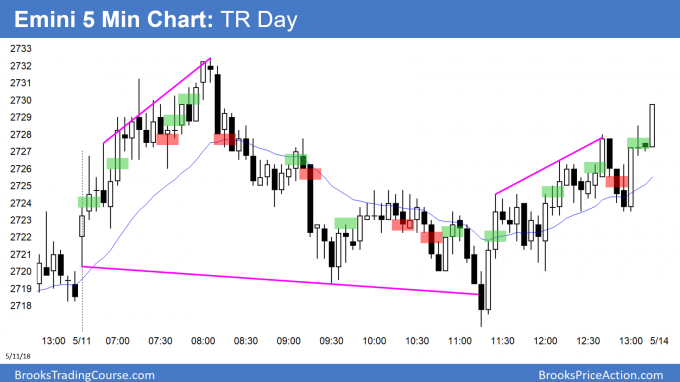
Here are several reasonable stop entry setups from Friday. I sometimes also show limit order entries and entries on the close of bars.
EURUSD bear rally to above 1.2000
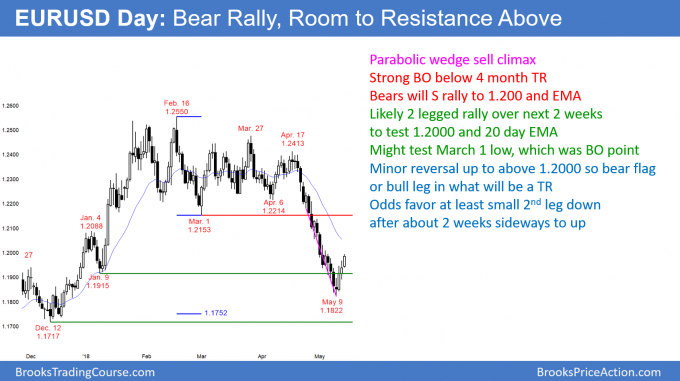
The EURUSD daily Forex chart has rallied 3 days after a parabolic wedge sell climax. It is near the sell zone, which is above 1.2000 and near the 20 day EMA.
The EURUSD daily Forex chart so far today is a bull trend day. This is the 3rd consecutive bull trend day after a parabolic wedge bottom. Last week, I said several times that the parabolic wedge selloff was probably a minor bottom and that it would lead to a bear rally to above 1.2000. Nothing has changed. While the rally is strong, it is the 1st break above a tight bear channel. There is therefore only a 20% chance that it will grow into a bull trend without at least a small test down.
The best the bulls will probably get over the next couple of weeks is a 2 legged rally to above 1.2000, a test back down to last week’s low, and then a trading range for 1 – 2 months. Since a 2 legged rally is likely, the bulls will buy the 1st dip below the low of the prior bar. They correctly expect the 1st reversal down to fail.
The bears know that there will be a pullback this week. They will therefore sell near the prior day’s high, expecting at least a 1 – 2 day pullback within a few days. Since they know the odds favor a 2nd leg up, they will take profits below the low of the prior day. That is exactly where the bulls will begin to buy. With both the bulls and bears buying, the odds favor at least a small 2nd leg up.
Weekly reversal bar, but only bear doji candle stick
While the weekly chart has a reversal bar in a bull trend last week, it was only a bear doji. That is a weak buy signal bar. Furthermore, it followed 2 big bear bars. Consequently, the rally will probably lead to a bear flag below the 20 week EMA over the next few weeks. At that point, the bulls might create a micro double bottom from a failed breakout below the bear flag. They would then have a 40% chance of a resumption of the bull trend on the weekly chart.
Overnight EURUSD Forex trading
The EURUSD 5 minute chart rallied 50 pips overnight. The 3 day rally is in a nested parabolic wedge bull channel. This is a buy climax and typically leads to a trading range. Therefore, the bears will begin to sell above prior highs for scalps and for a test below yesterday’s low. In addition, the bulls will begin to take profits above prior highs.
Finally, since the bulls expect a dip below the prior day’s low, many will begin to wait to buy below yesterday’s low. They will also want to buy around a 50% pullback. That is currently around the 1.1900 Big Round Number and Friday’s low.
There is no reversal yet on the 5 minute chart. But, a transition into a trading range is likely today or tomorrow. Therefore, the bulls and bears will switch to scalping for 10 – 20 pips. The bears will also begin to scale into shorts above prior highs for a 50 – 100 pip dip over the next few days.
Summary of today’s S&P Emini futures price action and what to expect tomorrow
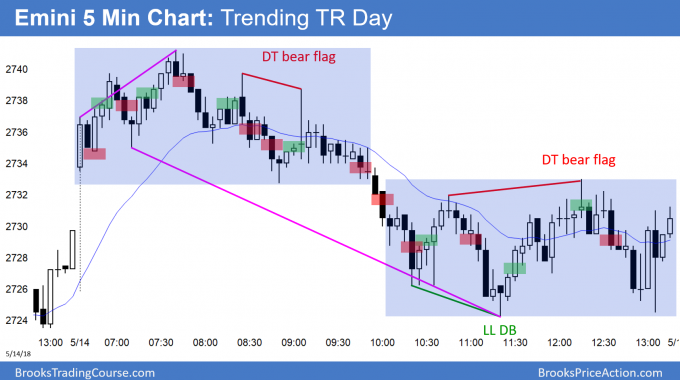
The Emini sold off from above Friday’s high in a Trending Trading Range day.
The Emini formed a Trending Trading Range day today. The bears see today as a sell signal bar on the daily chart. But, after an 8 bar tight bull channel, the odds are that any reversal down will be minor. The bears will therefore need at least a micro double top before they can create a swing down. Without that, the odds favor higher prices, even if there is a pullback for a few days first.
See the weekly update for a discussion of the price action on the weekly candlestick chart and for what to expect going into next week.
Traders can see the end of the day bar-by-bar price action report by signing up for free at BrooksPriceAction.com. I talk about the detailed S&P Emini futures price action real-time throughout the day in the BrooksPriceAction.com trading room. We offer a 2 day free trial.
When I mention time, it is USA Pacific Standard Time (the Emini day session opens at 6:30 am PST, and closes at 1:15 pm PST). You can read background information on the intraday market reports on the Intraday Market Update page.


Hi Al, when you post your stop entries on the above charts are you entering with the intention of swinging or are some strictly scalps. Or are those all possible swing setups and depending on the following bars are you determining whether you hold for a swing or a scalp.
thanks Al.
Everything is a reasonable trade. Some are swing trades, but most are scalps.