Emini already priced in Cohen and Manafort
I will update again at the end of the day.
Pre-Open market analysis
The Emini reversed up yesterday after Tuesday’s sell climax. It is a buy signal bar on the daily chart for today. However, the selling on the 60 minute chart was strong enough to make a 2nd leg sideways to down likely. Therefore, there are conflicting signals. That usually results in a trading range.
The bull channel on the weekly chart is tight. Consequently, the bulls are still in control and the odds continue to favor higher prices after every reversal attempt.
The market already priced in the news on Cohen and Manafort. Was anyone really surprised by the news? If the Emini reverses down for the next couple of months, the news will be the excuse. But, the real cause will traders again selling where they sold in January. For whatever reason, the computers thought that was a good place to sell in January, and they might still hold that belief. More likely, the Emini will continue up to 3,000 – 3,200.
Overnight Emini Globex trading
The Emini is unchanged in the Globex market. Since Tuesday’s selloff was strong, the Emini might go sideways to down for another day or two. “Might” means a lack of conviction, and that usually results in mostly sideways trading, which is what we have seen for 3 days.
Yesterday’s setups
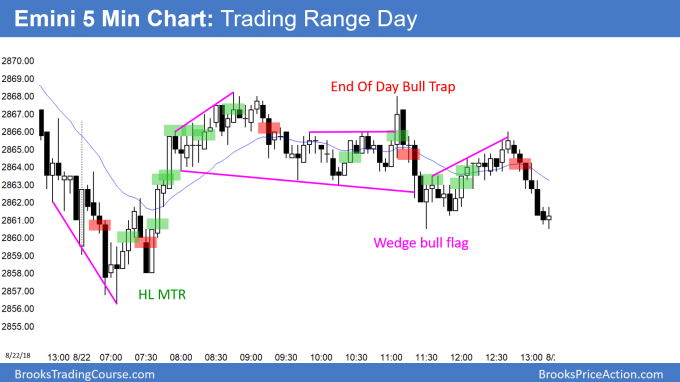
Here are several reasonable stop entry setups from yesterday. I sometimes also show limit order entries and entries on the close of bars. My goal with these charts is to present an Always In perspective. If a trader was trying to be Always In or nearly Always In a position all day, and he was not in a position at the moment, these entries would be logical times for him to enter.
EURUSD Forex 1st pullback after bull trend reversal
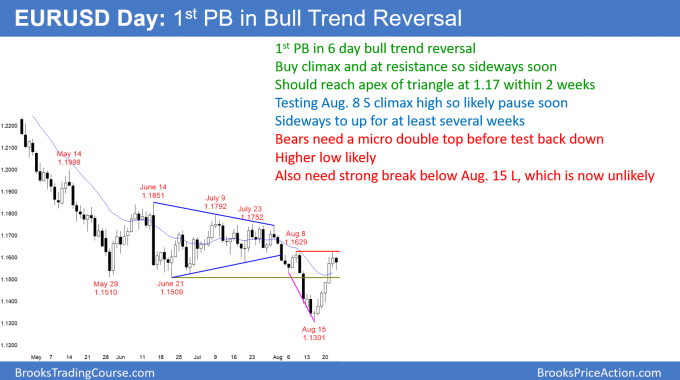
By trading below yesterday’s low, the EURUSD daily Forex chart had its 1st pullback after a bull trend reversal.
The EURUSD daily Forex chart reversed up strongly enough over the past 2 weeks to create a credible bull trend reversal. The odds therefore are for sideways to up trading for at least a month. When a market reverses up after a triangle breakout, the 1st target is the apex of the triangle. That is around 1.17. The next target is the top of the triangle, which is 1.18.
A pullback following a reversal is a cup and handle buy setup. While the bull flag can be a single day, like today, it will more likely last at least several days to a couple of weeks. Therefore, if the rally resumes tomorrow, today will not be the handle. The bulls will look for a 5 – 10 bar bull flag over the next several weeks. Then, the expect a rally to at least 1.18.
The bears always have a case, but their probability is now much less for at least a month. They hope that this is just a sharp, brief bear rally. They need at least a micro double top over the next few days. Then, they want an endless pullback from this rally and a move down to the 1.12 measured move target.
There is only a 30% chance that they will succeed. However, if they can stop the rally and create a trading range for a month or more, their probability will go up.
Overnight EURUSD Forex trading
I said yesterday that the bulls would buy the prior day’s low. Last night dipped below yesterday’s low and rallied 40 pips. Day traders will continue to buy below prior days’ lows and below intraday lows, betting on more sideways to up trading for at least several days.
Because the 5 minute chart is now getting pullbacks, the bears will begin to scalp. But, since the daily chart is now in a strong bull reversal, the odds favor higher prices for at least several weeks. Therefore, it will be easier to make money as a buyer.
Summary of today’s S&P Emini futures price action and what to expect tomorrow
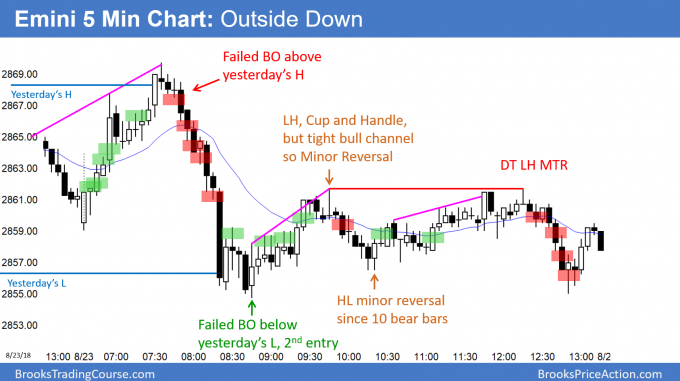
Here are several reasonable stop entry setups for today. I sometimes also show limit order entries and entries on the close of bars. My goal with these charts is to present an Always In perspective. If a trader was trying to be Always In or nearly Always In a position all day, and he was not in a position at the moment, these entries would be logical times for him to enter.
The Emini reversed down from above yesterday’s high to below its low. This created an outside down day. While the location on the daily chart is good for the bears, the weekly chart is still in a tight bull channel. Therefore, a reversal down from a double top with the January high will probably create a bull flag, not a bear trend.
Since tomorrow is Friday, weekly support and resistance are important. The bears want the week to close on its low to create a strong sell signal bar for next week. However, unless tomorrow is a big bear day, the week’s range will be small. When that happens, it has little predictive value.
See the weekly update for a discussion of the price action on the weekly candlestick chart and for what to expect going into next week.
Traders can see the end of the day bar-by-bar price action report by signing up for free at BrooksPriceAction.com. I talk about the detailed S&P Emini futures price action real-time throughout the day in the BrooksPriceAction.com trading room. We offer a 2 day free trial.
When I mention time, it is USA Pacific Standard Time (the Emini day session opens at 6:30 am PST, and closes at 1:15 pm PST). You can read background information on the intraday market reports on the Intraday Market Update page.


I am thinking that at some point after this morning’s open, the market became ‘always in long’ , until the top at the 10:30 bar(7:30 Pacific time)? If one draws a downtrend line from the 8/22 14:00 bar to the lower high at 15:35( 11:00 and 12:35 Pacific) , that downtrend is not violated until the middle of the 9:50 bar(6:50 Pacific) 8/23. Does one need to wait until that trend line break to view market as ‘always in long’ ? There is also the failed breakout on the opening bar today 8/23- below the major low at 14:55-8/22(11:55 Pacific). At what point would the reversal up from the failed breakout justify an ‘always in long’ position? It seems that a long position based on the failed breakout would justify the ‘always in long’ earlier than the trendline violation- does this thinking make sense? And if it does, where would that ‘always in long’ kick in ? One objective that you emphasis is to give a trader a reason to enter the market- so how would that approach work in this situation. I enjoy the course, and always appreciate your assistance. thx
My general rule on the open is if there are consecutive bull bars, and one is a big bull bar closing near its high, the Emini is Always In Long. Traders will buy above bars. That happened on the 2nd bar of the day. The bulls bought closes and above bull bars all of the way up. It stayed long until after the 2nd bear bar at the high. They would have gotten out there since it closed near its low. Some bears would sell up there, but the reversal was probably going to be minor. However, after there were 3 bigger bear bars closing near their lows, the Emini was clearly Always In Short.