Posted 6:48 a.m.
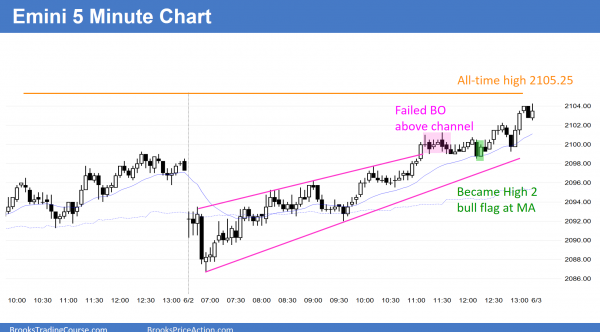
The Emini opened at the bottom of yesterday’s final bull channel, forming a double bottom at the 60 minute moving average. The first 3 bars formed a tight trading range, which increases the chances of more trading range price action today. Also, the bear breakout below yesterday’s bull channel increases the chances of a trading range for a couple of hours. Traders will mostly scalp until there is a strong breakout up or down, and the odds are that today will have a lot of trading range price action. This means that a swing up or down will probably be followed by an opposite swing after 2 – 3 hours.
Any day can become a strong trend day in either direction. When a day opens like this at support in the middle of yesterday’s range, the odds of a strong trend day at less than those of a trading range day.
Pre-Open Market Analysis
S&P 500 Emini: Emini price action still bullish for day traders
The Emini rallied in a broad bull channel on the 5 minute chart yesterday, and the Emini price action still bullish for day traders. A bull channel is effectively a bear flag. There is a 75% chance of a bear breakout and then a trading range today. If there is a bull breakout, there is also a 75% chance of a failed breakout that reverses down within 5 bars and then followed by a bear breakout and a big trading range. There is only a 25% chance of a successful breakout above the top of the channel followed by an accelerated bull trend.
The context on the daily chart is unusual. A successful bull breakout above the the 5 minute chart’s bull channel could quickly get back above the July high at the psychologically important round number of 2,100. The all-time high is only 5.25 points above that (the April 20 high). The bulls need a big bull breakout above this resistance on the daily chart. If they get it, the Emini could quickly reach a measured move up based on the height of the 2 month trading range (75 points) or, less likely, the 2 year trading range (300 points). Since most trading range breakouts fail (the past 10 attempts over the past 2 years to get above or hold above 2,100 have failed), the odds are that a breakout to a new high on the daily chart would not get far before it reversed back down.
The momentum up on the daily and weekly charts is strong. However, there have been many strong moves up and down over that past 2 years. All have led to reversals, which is what usually happens in a trading range. Strong momentum is not enough. The bulls need a breakout above the 2 year range and strong follow-through buying. Without that, the odds are that the current rally will reverse down, probably at least to the middle of the 2 year range (about 150 points below the 2,100 top of the range). With the strong bullish momentum, the Emini probably has to go sideways for at least a few days to create a micro double top before the bears will have a reasonable chance of a reversal down.
With a likely interest rate high in June or July, the breakout or failed breakout can happen any time over the next month. It can happen well before either FOMC meeting. The Emini is in the time window for either a breakout or a reversal, and the location is also good for a potentially big move up or down.
When the Emini is in breakout mode like this, there is a 50% chance that the breakout up or down will fail within a few bars and then reverse. The minimum objective of a successful breakout is a measured move based on the height of the 2 month trading range, which is about 75 points tall. This means that the minimum target for a successful bull breakout is around 2,175, and the minimum target for a successful bear breakout below the 2 month range is about 1,950, which is about the middle of the 2 year trading range (a 50% pullback from the February to April rally).
The Emini has been sideways in the Globex market and is down about 3 points. The odds favor a sideways to down move today that breaks below yesterday’s bull channel and lasts at least a couple of hours and has at least a couple of legs.
Forex: Best trading strategies
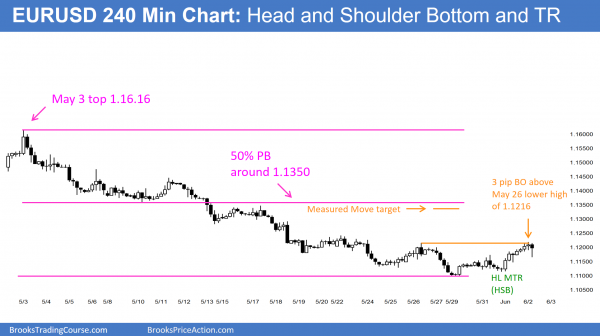
The 240 minute chart broke above the neck line of the Higher Low Major Trend Reversal (Head and Shoulders Bottom). The breakout was weak and the chart is still in a trading range, and therefore in breakout mode. The bears see a double top bear flag.
The EURUSD Forex chart is trying to reverse up from a measured move target and the bottom of the channel that began with the March 16 pullback from the strong March 10 bull breakout. It sold off over the past 4 weeks in a series of 5 consecutive sell climaxes. When a selloff has a series of 4 or more sell climaxes without much of a pullback, there is a 75% chance that there will soon be a TBTL Ten Bar, Two leg correction up. This means that the EURUSD chart will probably rally for a couple of legs and a couple of weeks, and the rally might have already begun. There might be one more push down before the rally begins. A reasonable target for the bear rally is about a 50% retracement of the 4 week selloff. That is in the 1.1350 area, and about 200 pips above the current low from 2 days ago.
Because of the potential for a surprise reaction to the probable Fed interest rate hike in June or July, there can be a big move up or down at any time up to and immediately after the announcement. Since there have been 5 sell climaxes, the odds of a big move down are 40% or less. If there is a big move, the odds are that it will be up and that it will reach the targets above, around 1.1350. It could go higher or lower, but the current price action makes a 2 week rally to around that level likely.
The 60 minute EURUSD Forex chart is still in bear channel, and therefore a bear trend. Last night, the bulls can rallied to only 3 pips above the May 26 lower high of 1.1216. This ended the series of lower highs and lows. The EURUSD 60 minute Forex chart is now in a trading range, and it is neutral. The bulls want a series of higher highs and lows, which would be a bull trend. They then want a measured move up to their target, which is a 50% pullback and a 200 pip rally.
The bears want last night’s breakout above the May 26 high to be a failed breakout. They see it as a slightly higher high double top with the May 26 high. They know that the EURUSD 60 minute chart is now in a trading range and not a bear trend. They also know that a trading range is neutral, and there is about a 50% chance of a bull breakout and a 50% chance of a bear breakout. With the trend leading to the trading range being down and with the rally being weak, the probability of the bear breakout is slightly higher.
With the EURUSD at the top of the 11 day trading range and in breakout mode, traders have been scalping while they wait for either a strong bull breakout or a bear reversal. They will be quick to swing trade on a big move up or down. Swing traders can hold their positions with wide stops. When the probability is 50%, the math is okay for a swing trade as long as the trader is holding for a profit that is at least twice his actual risk.
Summary of today’s S&P Emini futures price action and what to expect tomorrow
The Emini had trading range price action for the 1st half of the day and then became a strong bull trend,
The Emini looked like it was going to form a trading range day with a high around a measured move up from the low to the open. Instead, it had a rally in the middle of the day that converted the day into a bull trend day Although it did not reach the all-time high, the momentum up on the daily chart is strong enough so that it will probably get there within a week.
See the weekly update for a discussion of the price action on the weekly candlestick chart and for what to expect going into next week.
Traders can see the end of the day bar-by-bar price action report by signing up for free at BrooksPriceAction.com. I talk about the detailed S&P Emini futures price action real-time throughout the day in the BrooksPriceAction.com trading room, and a 2 day free trial is available.
When I mention time, it is USA Pacific Standard Time (the Emini day session opens at 6:30 am PST, and closes at 1:15 pm PST). You can read background information on the intraday market reports on the Intraday Market Update page.


Hey Al, just wanted to thank you for such a high quality and comprehensive course. There’s so much fluff and nonsense out there.
I’m amazed you’ve been able to see so much detail in the price action without using volume. I had initially been hesitant to watch your material because my style is primary based off of the relationship between volume and price action. It’s definitely opened my eyes.
Thanks
Hi Al,
You mentioned on EU analysis that “There might be one more push down before the rally begins.”. What was the reason for that? Is it due to MTR on 5mins chart or some other reason?
Many thanks
Saad
When a bottom is not clear, there is often one more push down. also, there is often a pullback to the bottom of the bull channel, which is the March 16 L, and it is a little lower.
Amazing!!!