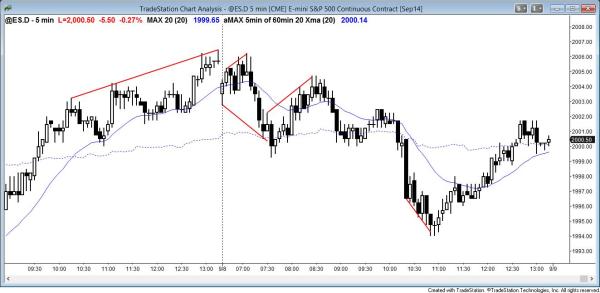
The Emini sold off from Friday’s wedge top and formed a trending trading range day. It rallied back into the upper range at the end of the day.
End of day comments about today’s Emini price action and day trading
The Emini fell from a lower high major trend reversal after yesterday’s wedge top. All of the breakouts up and down had bad follow-through, increasing the chances of persistent trading range price action. The result was that the breakout at 10:20 led to a lower trading range and the day became a trending trading range day. It entered a small pullback bull trend and reversed back up into the upper trading range by the end of the day. The Emini is continuing to struggle to find enough buyers to hold above 2,000, and this increases the chances that it will have to trade lower to find more buyers.
The Emini is in its 10th day of a 60 minute tight trading range, and is should soon get bull trend resumption or bear trend reversal on that chart.
S&P500 Emini intraday market update for price action day traders
Time of update 7:43 a.m. PST.
The dominant price action feature on today’s open for day traders was the reversal down from Friday’s wedge top, creating a wedge top trend reversal. Friday had a strong bull breakout and channel, but the day ended with a wedge top. Today had a rally that tested Friday’s wedge top, but that rally was a small wedge and it reversed down. The initial target for the bears was Friday’s 10:55 a.m. bottom of the wedge.
Friday had so much buying pressure that the odds are against a strong bear trend day today without first creating selling pressure. Even though the reversal down today was reasonably strong, it lack consecutive big bear bars that closed on their lows. This hesitation increases the chances of a trading range soon. If so, traders will begin to buy low, sell high, and scalp. If the Emini goes sideways for a couple of hours, it will then decide between bear trend resumption and trend reversal up.
Yesterday’s strong rally is more likely to evolve into a big trading range than into a bear trend. Today’s open is in the middle third of the day. This increases the chances of it being a magnet later in the day and the day becoming a doji candle on the daily chart. Although at the moment the Emini is in a bear leg, a trading range or broad bear channel are more likely than a strong bear trend.
S&P500 Emini 60 minute, daily, weekly, and monthly candle charts
The daily chart has been in a tight trading range for 9 days. This has been a weak, rising broad bull channel on the 60 minute chart. However, the selloff on Thursday fell below the prior 60 minute higher low (in fact, it broke below the last 3 higher lows and tested the bottom of the entire trading range). A bull channel needs to continue to form higher lows. Once there is a lower low, the channel ( a bull channel is a bull trend) has transformed into a trading range. This is what happened on the 60 minute channel last week.
Once in a trading range, the price action begins to become neutral. Initially, the trading range is just a big pullback, and the breakout is more likely to be in the direction of the trend. With each bar that gets added to the range, the trading range becomes more and more neutral. Eventually, the probability of an upside breakout falls to about the same as the probability of a bear breakout. The bulls will try to get trend resumption up. This would in the form of a bull breakout. They would then look for a measured move up. That move, would be close to the top of the weekly channel. Most tests of the top of a channel are followed by a reversal down to the bottom of the channel.
The bears want the trading range to form a topping pattern, like a lower high major trend reversal (also called a head and shoulders top). They then want a downside breakout and a measured move down. However, since there are many support levels below, the bears want the fall below each one to trigger another wave of selling that takes the market below the next one. This cascade of bear breakouts can lead to a drop that is much larger than a measured move that is based on the height of the 9 day tight trading range. However, there is no sign yet that this will happen.
Day traders need to be prepared so that they will not be paralyzed. They must remember that risk happens fast! This means that a breakout could be surprising big and have several days of follow-through before beginning traders get past their denial and are able to begin to look to sell.
See the weekly update for a discussion of the weekly chart.
Traders can see the end of the day bar-by-bar price action report by signing up for free at BrooksPriceAction.com. I talk about the detailed Emini price action real-time throughout the day in the BrooksPriceAction.com trading room, and a 2 day free trial is available.
When I mention time, it is USA Pacific Standard Time (the Emini day session opens at 6:30 am PST, and closes at 1:15 pm PST). You can read background information on the intraday market reports on the Intraday Market Update page.

