Premarket price action analysis
For tomorrow’s analysis, wait until after today’s close. Then, look at the bottom of this post for “Outlook for tomorrow’s Emini price action and day trading.”
If you want to see today’s premarket analysis, I posted it after yesterday’s close in yesterday’s blog at S&P500 Emini intraday market update.
S&P500 Emini intraday market update for price action day traders: opening bull trend reversal and an island bottom
Posted 7:31 a.m.
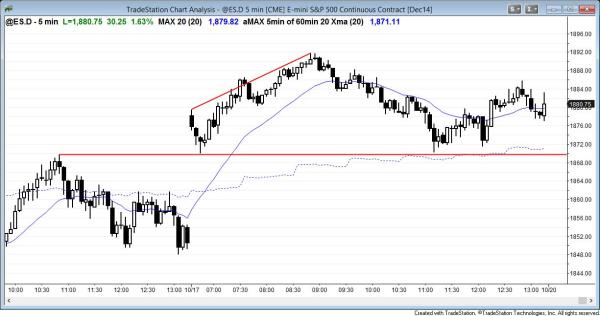
The Emini gapped up today, forming the 2 day island bottom that I mentioned was possible. It tested down to yesterday’s high, but the bulls kept the gap open. The Emini had an opening reversal up on the test of yesterday’s high. The rally lacked consecutive big bull trend bars, and that makes the rally more likely to be a bull leg in what will become a trading range. The bad follow-through bars are a sign that there is heavy scalping by the bulls. They are quick to take profits, which means they do not have a lot of confidence in the rally. This increases the chances that they will eventually stop buying and then the bears will have a leg down. The open of the day is currently in the middle of the range, again increasing the chances of a trading range day.
Although the day is currently always in long and in a bull trend, traders will be ready to short. Until there is a strong breakout up or down with good follow-through, day traders will treat this like a trading range day and be quick to scalp. There is no sign of a top yet and there is a measured move target above, based on the breakout above the high of the first bar of the day. However, until the bears create a credible top, the odds are that the rally will continue, and it might end up as a strong bull trend day.
The target for the island bottom is a measured move up to test the breakout below the October 8 double bottom. The measured move might be from the Wednesday high. It might also be from yesterday’s high, because today is a bull breakout above a low 2 (ABC) 60 minute bear flag. Although the breakout has been very strong and the odds favor a test down, the market has been in a trading range since June. It is possible that this selloff is simply an attempt to expand the range.
The Emini had 2 legs down. The first leg was the bull flag that ended with the October 8 double bottom. The second leg was the current sell climax since then. The bulls hope that this second leg is just a sell vacuum down to a new low in the trading range.
The bears believe that the selloff was so strong that the current rally will fail and then test down. The bears have higher probability, higher risk (to above the October 9 high), and lower reward (the market is unlikely to fall too much further because the monthly chart is in a small pullback bull trend). The bulls have lower probability, but a better reward compared to risk.
When both the bulls and bears have reasonable arguments, the result is usually a trading range, and that is what is likely over the next month. The Emini will probably test above the October 8 low and then test this week’s low. From there, it will then decide between trend resumption down and trend reversal up on the daily chart.
Outlook for tomorrow’s Emini price action and day trading

The Emini gapped up and formed a 2 day island bottom on the daily chart. It tested the gap late in the day and held it. The day was a trading range day.
The Emini gapped up to create a 2 day island bottom. It then tested down to yesterday’s high and formed an opening reversal buy setup. It did not close the gap above yesterday’s high. The price action in the rally had bad follow-through, as I mentioned above, and the rally became a bull leg in a trading range day. The day closed around the open of the day and it was the third doji day in the past 4 days. The Bulls are trying to get above the August low and the October 10 low. Even if they do, the odds still favor a test down before a reliable bottom is in.
See the weekly update for a discussion of the weekly chart.
Traders can see the end of the day bar-by-bar price action report by signing up for free at BrooksPriceAction.com. I talk about the detailed Emini price action real-time throughout the day in the BrooksPriceAction.com trading room, and a 2 day free trial is available.
When I mention time, it is USA Pacific Standard Time (the Emini day session opens at 6:30 am PST, and closes at 1:15 pm PST). You can read background information on the intraday market reports on the Intraday Market Update page.

