Premarket price action analysis
See yesterday’s “Outlook for tomorrow’s Emini price action and day trading”
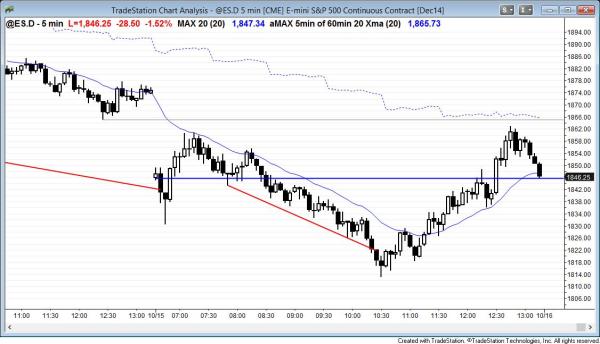
S&P500 Emini intraday market update for price action day traders: bull trend reversal after a sell climax
Posted 7:04 a.m.
The S&P500 Emini had a bull trend reversal after a sell climax and it is in a bull trend. It opened with a big gap down in a market that is oversold on the 5 minute, 60 minute, and daily charts. Although it can become much more oversold before finally reversing, the downside is usually limited until after it corrects sideways or up. Some bears will see this as a windfall profit and will then take partial or full profits. Once they do, they will not look to sell again immediately. Instead, they will usually wait for 10 or more bars and at least two legs.
The reversal probably formed the low of the next few hours and maybe for the day. Traders need to trade very small or wait until the bars become much smaller. Because the Emini reversed up from a bear breakout below a bear channel, it probably will work its way up to the top of the channel, which at the moment is above yesterday’s low. However, yesterday’s low is resistance, and it might hold all day. If so, today could become an island bottom and the market might gap up tomorrow.
Outlook for tomorrow’s Emini price action and day trading

The Emini broke below the bottom of a 60 minute bear channel on the open and then reversed up strongly. However, it failed to get above yesterday’s low and entered an endless pullback. Bears were selling above every bull reversal bar and they sold every bull trend bar that closed near the moving average. After breaking below the bottom of the 5 minute channel, it reversed up again to a new high of the day. It closed at the open and created a big doji candle on the daily chart.
After breaking below the 60 minute bear channel and reaching a measured move down on the daily chart (from the all time high to the October 2 low, which was the bottom of a bull flag), the Emini reversed up at 10:30 again, this time after breaking below a 5 minute bear channel. It worked its way back to the high of the day. This created a trading range day and reversal day on both the 5 minute chart, and a doji reversal day on the daily chart. Traders know that when there is a strong selloff in the middle of October, the market often reverses up and trends up for the rest of the year. Many traders bought what they saw as bargains today, hoping that they have a relatively low risk entry with a big potential reward. That psychology created today’s bull trend reversal.
Because the daily chart is so oversold and today gapped down, tomorrow might gap up. If so, today would be an island bottom on the daily chart and it could mark the low of the leg down. Although this is possible, the selling has been so strong that the first reversal up probably will be sold, and the Emini will probably have to test today’s low within the next couple of weeks. It might then form a major trend reversal and eventually rally to test the all-time high.
Although less likely, today’s gap might remain open and become a measuring gap. If so, the projection down is to around 1,700, which is just below the monthly moving average.
Since today was a doji day, it was a trading range day. Because today’s range was so big and the day closed in the middle third, tomorrow will probably have a lot of trading range price action, and it might be an inside day. Since the legs were so big today, there will probably be swings up and down tomorrow for day traders. Because today was a reversal day, tomorrow might be a bull trend day. Since the stock market is so oversold, the chance that tomorrow will be a strong bear trend day is less likely.
The Emini had been in a trading range for 4 months, and it broke below the range on Monday when it fell below the August low of 1891.75. The first target for the bulls is a test of that low. If it gets there, it will probably find sellers. The bulls who bought today will take profits at that resistance level, and bulls who bought within that 4 month trading range will use the rally to exit with smaller losses.
Another reason for a possible test back down is that the Emini came close to the bottom of the channel on the weekly chart, but did not quite reach it. That bull trend line is therefore still a potential magnet pulling the market down.
After several weeks of strong selling, the Emini will probably begin to enter a trading range on the daily chart. Once the range forms, bears will look for trend resumption down and the bulls will look for a trend reversal up. Since the monthly chart is still bullish, the downside is probably limited until the bears can create some selling pressure on the monthly chart.
See the weekly update for a discussion of the weekly chart.
Traders can see the end of the day bar-by-bar price action report by signing up for free at BrooksPriceAction.com. I talk about the detailed Emini price action real-time throughout the day in the BrooksPriceAction.com trading room, and a 2 day free trial is available.
When I mention time, it is USA Pacific Standard Time (the Emini day session opens at 6:30 am PST, and closes at 1:15 pm PST). You can read background information on the intraday market reports on the Intraday Market Update page.

