Emini parabolic wedge top at measured move target
I will update again at the end of the day.
Pre-Open market analysis
The Emini rallied for 4 days in a tight bull channel on the 60 minute chart. This is extreme and unsustainable, and therefore climactic. It pulled back in a tight range yesterday from a 4 day parabolic wedge rally on the 60 minute chart. The high was at a measured move target based on the 60 minute chart (not shown).
A buy climax will usually pull back for 10 or more bars. This is about a day and a half on the 60 minute chart. A major reversal comes less than 40% of the time. Yesterday’s high might be the start of the pullback. Since Monday had a triangle, it is probably the Final Bull Flag. Therefore, a minimum target is a test of the apex of that triangle today or Thursday.
Overnight Emini Globex trading
The Emini is down 2.5 points in the Globex session. It therefore might gap down. This would make yesterday a 1 day island top. If so, that slightly increases the chance of a minor reversal for a few days. But, most small gaps close within the 1st hour. While a 1 – 2 day pause or pullback is likely, it can come even if today gaps down and then rallies back above yesterday’s low, closing the gap.
The one thing that is unlikely today is a strong bull trend day. The 5 minute chart’s bullish momentum has reduced over each of the past 2 days. This makes at least a small pullback likely. Therefore, today will probably be either another trading range day or a small bear day.
As always, there is a 20% chance of a big trend up or down on any day.
Yesterday’s setups
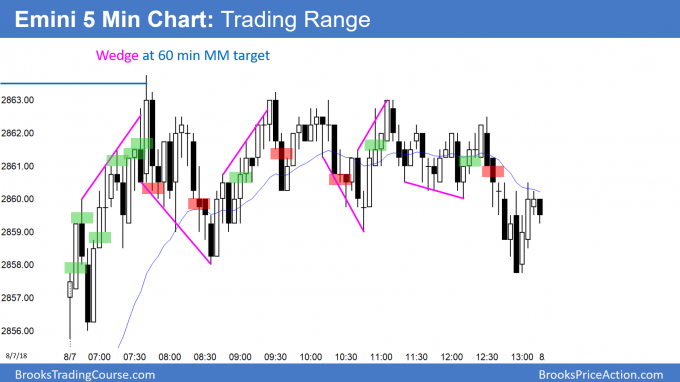
Here are several reasonable stop entry setups from yesterday. I sometimes also show limit order entries and entries on the close of bars. My goal with these charts is to present an Always In perspective. If a trader was trying to be Always In or nearly Always In a position all day, and he was not in a position at the moment, these entries would be logical times for him to enter.
EURUSD Low 1 bear flag after selling pressure
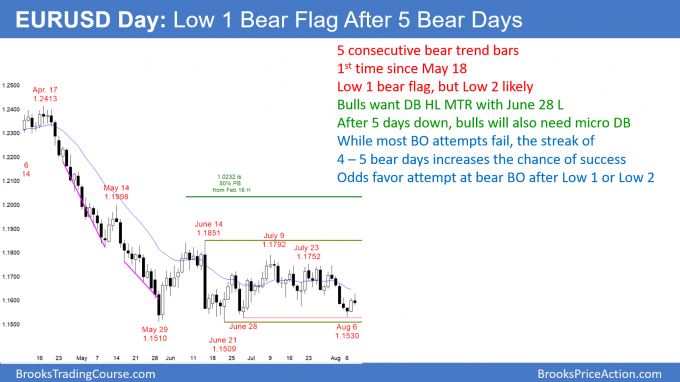
After 5 consecutive bear days on the EURUSD daily Forex chart, the bears will probably break below the June low. If today is a bear day, It will be a Low 1 bear flag and a sell signal bar for tomorrow.
The 5 consecutive bear days on the EURUSD daily Forex chart after the breakout below the 2 month triangle is a sign that the selling pressure has increased. This is a change and it makes a break below the June low likely. If today has a bear body, it will be a Low 1 bear flag and a sell signal bar for tomorrow.
The final 2 days of the selloff had small bodies. This represents a loss of momentum near the bottom of the range. Therefore, the bears will probably need 2 attempts to break below the range. As a result, the chart will likely enter a tight trading range over the next few weeks. If so, there will probably be a small double top and a small double bottom. This will slightly reduce the bearishness of the 5 bear days.
The small double top would be a Low 2 bear flag. If the bears then get consecutive closes below the June 21 low, traders will conclude that a 300 pip measured move down is underway.
Alternatively, if the bulls get 3 or more bull days, traders will believe that the chart formed a double bottom with the June 28 low. The pattern would then be a micro double bottom and a double bottom higher low major trend reversal. Without this, the odds now favor a bear breakout.
Overnight EURUSD Forex trading
I said yesterday that the 5 minute chart would probably bounce to between 1.16 and 1.1650 in the next 2 days and stall. This is because the daily chart will probably enter a tight trading range over the next week. That range will have a small double bottom and a small double top.
Day traders will expect this and look for reversals every couple days. They therefore will buy around 1.1550 – 1.1570 expecting about a 50 pip rally from a double bottom with the August 6 low. This would create a micro double bottom on the daily chart.
The rally will likely only last a couple of days. Day traders will then sell again above 1.16. If the selloff from there is strong, they will look for a swing trade and a break below the June low.
Summary of today’s S&P Emini futures price action and what to expect tomorrow
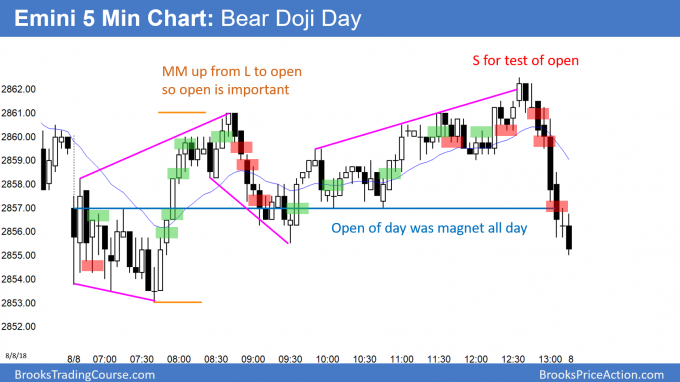
Here are several reasonable stop entry setups for today. I sometimes also show limit order entries and entries on the close of bars. My goal with these charts is to present an Always In perspective. If a trader was trying to be Always In or nearly Always In a position all day, and he was not in a position at the moment, these entries would be logical times for him to enter.
After trading below yesterday’s low, the Emini reversed up sharply. It then entered a trading range. The open of the day was a magnet all day. Today is a High 1 bull flag buy signal bar for tomorrow. But, the bears got a close below the opne. Therefore, the bears will probably get a little more sideways to down trading after their 4 day parabolic wedge top at a measured move target.
See the weekly update for a discussion of the price action on the weekly candlestick chart and for what to expect going into next week.
Traders can see the end of the day bar-by-bar price action report by signing up for free at BrooksPriceAction.com. I talk about the detailed S&P Emini futures price action real-time throughout the day in the BrooksPriceAction.com trading room. We offer a 2 day free trial.
When I mention time, it is USA Pacific Standard Time (the Emini day session opens at 6:30 am PST, and closes at 1:15 pm PST). You can read background information on the intraday market reports on the Intraday Market Update page.


