Emini outside up day and test of Monday’s gap
I will update again at the end of the day
Pre-Open market analysis
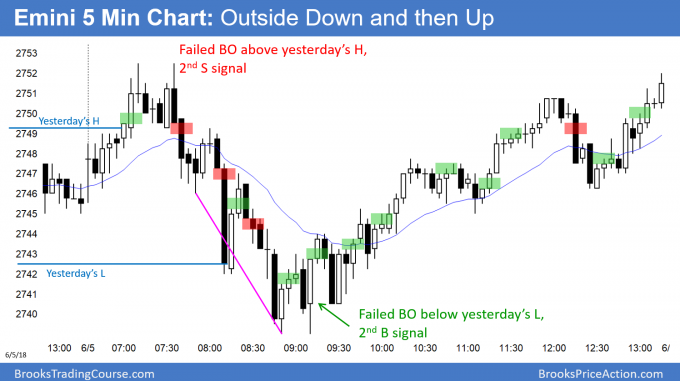
Yesterday began as an outside down day on the daily chart. However, it reversed back up and it was therefore also an outside up day. The bears tested the gap below Monday’s low, but were unable to close it. The rally should continue up to the March high above 2800. It might accelerate up soon in a buy vacuum since there is no resistance until then.
Unless the bears can create consecutive strong bear bars, the odds continue to favor higher prices.
Overnight Emini Globex trading
The Emini is up 5 points in the Globex market. After 3 bull days and a breakout above a 3 month trading range, the odds favor a continued rally up to 2800.
A rally contains mostly bull days. Bull days open near their lows. There is usually an early selloff that reverses up. That selloff puts a small tail on the bottom of the bull bars on the daily chart. Therefore, bulls will look to buy a reversal up from an early selloff.
Furthermore, bull days on the daily chart tend to rally at the end of the day and close near their highs. Consequently, day traders will look for a rally in the final 30 – 60 minutes.
Rallies on the daily chart often have 1 – 2 day bear trends on the 5 minute chart. When they come, day traders will swing trade their shorts. However, the odds are that the 4 month trading range trading has transitioned into bull trend trading. Day traders will look for early buy signals every day until the trend ends.
Yesterday’s setups
Here are several reasonable stop entry setups from yesterday. I sometimes also show limit order entries and entries on the close of bars.
EURUSD Forex bear rally to 20 day EMA
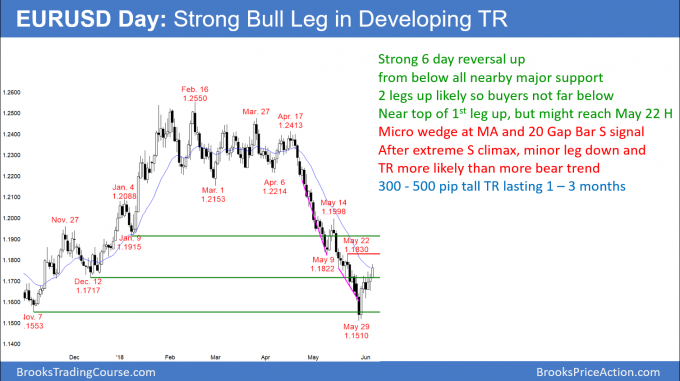
The EURUSD daily Forex chart rallied 6 days to the EMA. The bulls want a gap up today and a measured move up. But, this is the 1st pullback to the EMA in over 20 days. The bears therefore will try for a minor reversal down from a 5 day micro wedge rally.
The EURUSD daily Forex chart has reversed up strongly from major support. The odds are that it is now in a trading range that will last from 1 – 3 months. While the bears want a micro wedge top today at the EMA, the momentum up is strong enough so that a 2nd leg up is likely. There are therefore buyers below at around a 50% pullback.
Today’s close is important. If it is above Monday’s high and the moving average, there will be a gap above Monday’s high. The bulls will then try for a measured move up to near the May 14 high at around 1.20. If instead today closes below Monday’s high, it will increase the chance of a pullback over the next week from a 5 day micro wedge top.
Despite the strong bear trend, it was extremely climactic. In addition, the reversal up was strong and at major support. Consequently, the odds favor at least 2 legs up. This initial reversal up is strong enough to make traders believe that a 2nd leg up is likely, even if there is a strong 2 – 3 day selloff within the next week. The bears have only a 30% chance of a strong break below last week’s low without at least a micro double top.
Overnight EURUSD Forex trading
The EURUSD 5 minute Forex chart rallied 70 pips overnight. Since there is now a 3 day wedge rally to the 20 day EMA, the bears will begin to sell again. However, they know that there are buyers below at around a 50% pullback from the 6 day rally and the 2 minor lows around 1.1650. Therefore, the bears will be quick to take profits.
The bulls want the rally to continue up to the May 14 major lower high just below 1.20. While the 6 day rally has been strong, there was a 4 day tight range in its middle. It is therefore a magnet below.
More likely, the rally will stall today or tomorrow, which will generate confusion. Confusion is a hallmark of a trading range. Since the trading range will be at least 300 pips tall, traders willing to hold positions for several days will be able to scalp for 50 – 100 pips. They will sell rallies and buy selloffs.
Day traders have had legs up and down over the past week that were big enough for 20 – 30 pip scalps. That will probably be the same today.
Summary of today’s S&P Emini futures price action and what to expect tomorrow
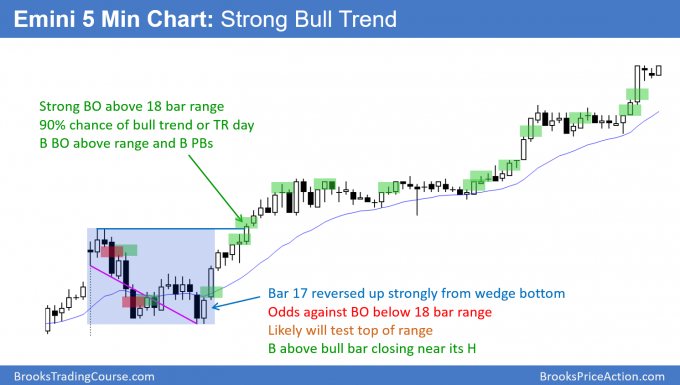
The Emini rallied sharply from a wedge selloff. It then entered a tight trading range. This led to trend resumption up at the end of the day.
The Emini had a 50% pullback from yesterday’s low on the open. It then reversed up strongly from a wedge bottom. This was the 4th consecutive bull trend, and the odds are that the rally will continue up to 2800 and the March major lower high.
See the weekly update for a discussion of the price action on the weekly candlestick chart and for what to expect going into next week.
Traders can see the end of the day bar-by-bar price action report by signing up for free at BrooksPriceAction.com. I talk about the detailed S&P Emini futures price action real-time throughout the day in the BrooksPriceAction.com trading room. We offer a 2 day free trial.
When I mention time, it is USA Pacific Standard Time (the Emini day session opens at 6:30 am PST, and closes at 1:15 pm PST). You can read background information on the intraday market reports on the Intraday Market Update page.


During strong breakouts, computers often use the open of the 1st bar of the breakout to the close of the final bar. If it goes beyond, then they use the height of the entire BO and not just the bodies.
Hi Al,
I wonder why sometimes you draw measured moves from the body of the bar at times and other times you draw from the the tails?