Emini and Forex Trading Update:
Tuesday April 9, 2019
I will update again at the end of the day.
Pre-Open market analysis
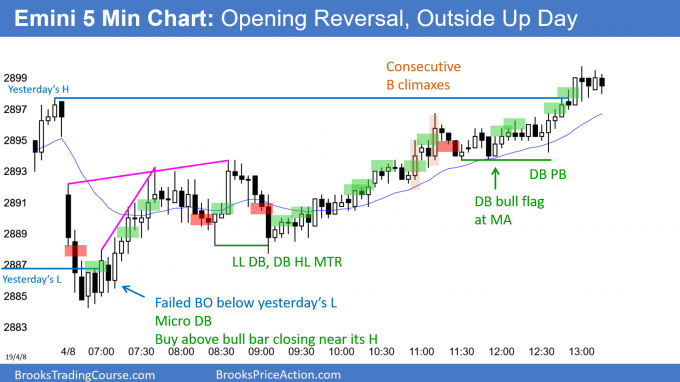
The Emini yesterday had its 1st pullback in 9 days on the daily chart. The bulls bought below Friday’s low and the bull trend continued to above Friday’s high. Yesterday therefore was an outside up day in a bull trend. It is now a buy signal bar for today.
The bulls are trying to break above the 2900 Big Round Number, and then the all-time high. There are climaxes on the daily and weekly charts. This reduces the chance of a strong rally from here. But, there is no reversal yet. Consequently, the odds favor higher prices.
While the odds favor higher prices, they could quickly switch in favor of the bears. The bears need this week to sell off and close near its low. It would then reverse last week’s bull breakout. Furthermore, it would be a Low 3 sell signal bar on the weekly chart. That would be a micro wedge top.
If today is a bear inside day after yesterday’s outside up day, it would be an ioi sell signal bar for tomorrow. If instead it falls below yesterday’s low and closes near its low, it would be a reversal day. That, too, would be a sell signal bar for tomorrow.
Overnight Emini Globex trading
The Emini is down 6 points in the Globex session. Yesterday was a buy climax. Consequently, there is only a 25% chance of another big bull day today.
In addition, there is a 75% chance of at least a couple hours of sideways to down trading that begins by the end of the 2nd hour. It might begin on the open.
The high of the Globex session was exactly 2900.00. Today is the 3rd day testing that level. If the Emini does not break above it this week, it will probably try the other direction… down, at least for a few days.
There is a nested buy climax on the daily chart. Since the rally is stalling at resistance, there is an increased chance of one or more bear trend days this week.
It is always possible that there could be a couple big bull days breaking far above the resistance. But, they would be late in a buy climax. They therefore would probably lead to exhausted bulls. Consequently, there would likely then be profit-taking for a couple of weeks rather than a continuation up to above the all-time high.
Yesterday’s setups

Here are several reasonable stop entry setups from yesterday. I show each buy entry with a green rectangle and each sell entry with a red rectangle. I rarely also show limit order entries and entries on the close of bars. My goal with these charts is to present an Always In perspective. If a trader was trying to be Always In or nearly Always In a position all day, and he was not currently in the market, these entries would be logical times for him to enter.
EURUSD Forex market trading strategies

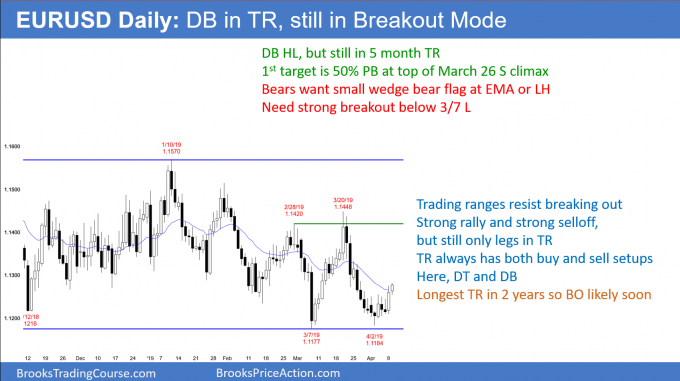
The EURUSD daily Forex chart resumed its 6 day rally yesterday from a double bottom with the March low. It is testing the March 22 low and the 20 day EMA. Since this is resistance, it could test back down from here.
However, the March 26 high is a stronger magnet. That is the top of the most recent sell climax. Furthermore, it is around a 50% retracement of the late March selloff. That means it is also the middle of the 5 month trading range.
Overnight EURUSD Forex trading
The EURUSD rallied in a tight bull channel through the 1st half of yesterday. It then entered a tight trading range. The rally resumed in the Asia session. However, it converted into a broader and therefore weaker bull channel at the start of the European session. It evolved into a trading range 4 hours ago. Day traders today will be back to scalping as they wait for a breakout up or down.
On the 240 minute chart, the March 25 high is the start of a bear channel after a strong bear breakout. That typically gets tested. Consequently, the 6 day rally will likely get there within a week.
The rally from here to there will probably be weak. Once there, the chart will likely go sideways for a few days. The EURUSD Forex market would be back to the middle of its 5 month range. Traders will then decide if the rally continues to the top or reverses back to the bottom.
Summary of today’s S&P Emini futures price action and what to expect tomorrow

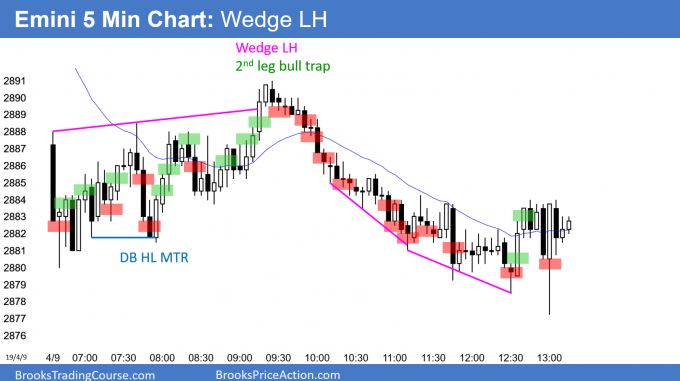
Here are several reasonable stop entry setups for today. I show each buy entry with a green rectangle and each sell entry with a red rectangle. I rarely also show limit order entries and entries on the close of bars. My goal with these charts is to present an Always In perspective. If a trader was trying to be Always In or nearly Always In a position all day, and he was not currently in the market, these entries would be logical times for him to enter.
End of day summary
The Emini was in a trading range for the 1st several hours. The bull breakout reversed down from just above the 60 minute EMA and the open of the week. There was a late bear breakout to a new low and today closed near its low.
Yesterday was an outside up day. By today trading below yesterday’s low, today triggered a micro double top sell signal at the 2900 resistance level. There is also a nested wedge top on the daily chart.
However, the past 2 days were bull days and every pullback for 3 months has lasted only 1 – 2 days. Consequently, the bears will need one or more big bear days or several small bear days to convince traders that they have taken control.
See the weekly update for a discussion of the price action on the weekly chart and for what to expect going into next week.
Trading Room
Traders can see the end of the day bar-by-bar price action report by signing up for free at BrooksPriceAction.com. I talk about the detailed S&P Emini futures price action real-time throughout the day in the BrooksPriceAction.com trading room. We offer a 2 day free trial.
Charts use Pacific Standard Time
When I mention time, it is USA Pacific Standard Time (the Emini day session opens at 6:30 am PST, and closes at 1:15 pm PST). You can read background information on the intraday market reports on the Intraday Market Update page.

