Trading Update: Monday November 1, 2021
Emini pre-open market analysis
Emini daily chart
- Friday made another new all-time high and it was another bull bar closing near its high. It also closed just above the 4600 Big Round Number.
- Since Friday was the last day of the month, with a gap up today, there will be a gap on the daily, weekly, and monthly charts.
- September traded above the August high and then below the August low. It was therefore an outside down month.
- October was an outside up month.
- Consecutive outside bars is an Emini OO pattern (outside-outside) Breakout Mode. That means traders will buy above and sell below.
- A minimum goal is a measured move based on the height of the Emini OO pattern. For the bulls, a measured move up is 4934.50.
- Two weeks ago on the daily chart, the Emini also broke above a 4-month trading range. A measured move up based on that trading range is 4802.00.
- Since October closed near its high, November should trade above the October high, which would trigger the OO buy signal. It will probably do that today or early this week.
- There is always a bear case, and there is always at least a 40% chance of it happening.
- The bears want a reversal down, even if there is first a breakout above the monthly OO pattern.
- An inside bar after an outside bar is common. If November is a bear inside bar closing near its low, there would be an ioi Breakout mode pattern (August is inside of September’s range). That, or any bear bar closing near its low in November or December, would be a credible sell signal on the monthly chart.
- At the moment, traders expect higher prices in November.
- There is a seasonal tendency for the market to rally between October 26 and November 5. That increases the chance of a break above the October high this week.
Emini 5-minute chart and what to expect today
- Emini is up 12 points in the overnight Globex session. It will probably gap up today, forming a gap up on the daily, weekly, and monthly charts.
- A gap up to a new high increases the chance of a trend day today. If there is a trend, it is more likely to be in the direction of the gap (up).
- When there is a gap, there is often an attempt to close the gap, especially in the 1st hour.
- Bulls will look for a reversal up from around yesterday’s high. Sometimes a gap will close and the Emini will still reverse up and form a bear trend.
- The bears want a Bear Trend From The Open.
- If they cannot get that, they would like today to sell off at some point and then close below Friday’s high. That would increase the chance of lower prices tomorrow.
- However, the best they probably can get is a pullback lasting a few days.
- The Emini has rallied in a tight bull channel for several weeks. That increases the chance of a pullback and then a 1- to 2-week trading range starting at any time.
Friday’s Emini setups


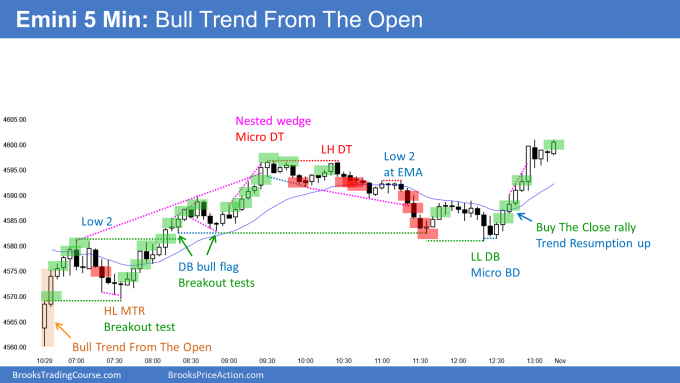
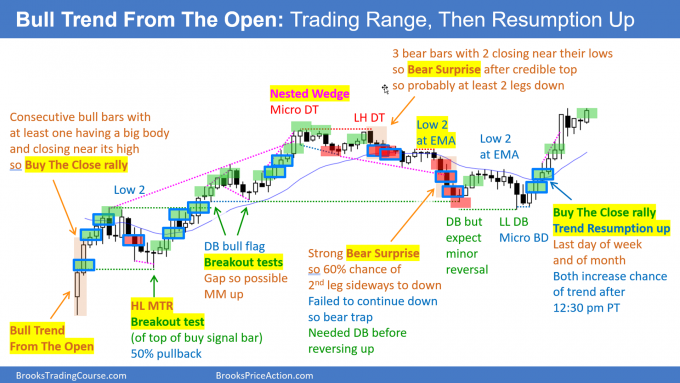
Here are several reasonable stop entry setups from Friday. I show each buy entry with a green rectangle and each sell entry with a red rectangle. Buyers of both the Brooks Trading Course and Encyclopedia of Chart Patterns have access to a much more detailed explanation of the swing trades for each day (see Online Course/BTC Daily Setups).
My goal with these charts is to present an Always In perspective. If a trader was trying to be Always In or nearly Always In a position all day, and he was not currently in the market, these entries would be logical times for him to enter. These therefore are swing entries.
It is important to understand that most swing setups do not lead to swing trades. As soon as traders are disappointed, many exit. Those who exit prefer to get out with a small profit (scalp), but often have to exit with a small loss.
If the risk is too big for your account, you should wait for trades with less risk or trade an alternative market like the Micro Emini.
EURUSD Forex market trading strategies
EURUSD Forex daily chart

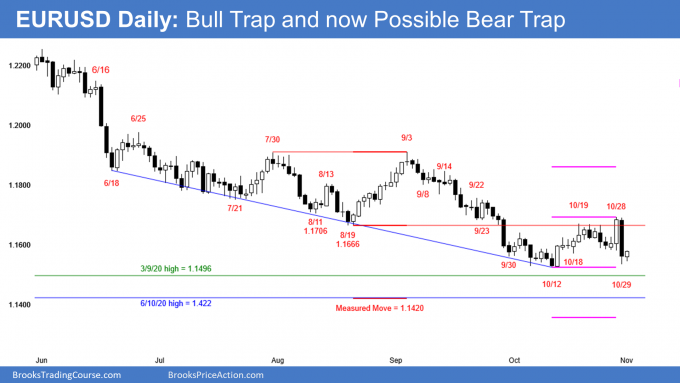
- After a big bull breakout on Thursday, there was an even bigger reversal down on Friday. Thursday was therefore a bull trap. It was also a 2nd failed attempt to get back above the August 19 low.
- On the weekly chart, last week traded above the high of the prior week and then below the low. It was therefore an outside down week. However, it had a prominent tail below the low and the low was above the low from 2 weeks ago. This is less bearish than it could have been. Since there is a 4-bar tight trading range, there is an increased chance of more sideways trading this week.
- On the monthly chart, October was the third consecutive bear bar. However, it had a small body and closed a fraction of a pip above the September low. It, too, was therefore less bearish than it could have been.
- I have been saying for several weeks that the EURUSD should fall below the March 9, 2020 high or the June 10, 2020 high. Friday increased the chance that it will happen within a couple weeks.
- The EURUSD has been in a trading range for 7 years. Those 2 highs were breakout points for last year’s strong rally.
- When a market is in a trading range and it gets near support or resistance, it usually goes beyond it before reversing.
- That is the reason why I have written repeatedly that the EURUSD should fall to 1.15 or possibly 1.14.
- However, last year’s rally was very strong, and it was stronger than the current reversal down from the May high. That makes it likely that the selloff is just a big pullback from last year’s rally.
- Therefore, there should soon be a reversal up lasting at least several weeks, and it might reach the September 3 high. It should begin after a dip below one or both of those breakout points, but the reversal up can begin at any time.
- There is always at least a 40% chance that the opposite of what is likely will happen. Consequently, there is about a 40% chance that the selloff will continue down to near the bottom of the 7-year trading range.
- If the bears get consecutive bear bars closing near their lows and below the June 10, 2020 high, the odds of the selloff continuing to near last year’s low will be more than 50%.
- At the moment, the EURUSD will probably fall to 1.15 or 1.14 within a few weeks, but then try to reverse up.
- The bears need follow-through selling within a few days. If they do not get it, Friday will be just a sell vacuum test of the October 12 low and a bear trap, and the bulls will try to get a reversal up from a higher low major trend reversal.
- A measured move up above the October 28 high, which is the neck line of the double bottom, would be almost to the September 3 high.
- A measured move down would be below the June 10, 2020 high.
Summary of today’s S&P Emini futures price action and what to expect tomorrow
- I will post chart after the close.

End of day summary
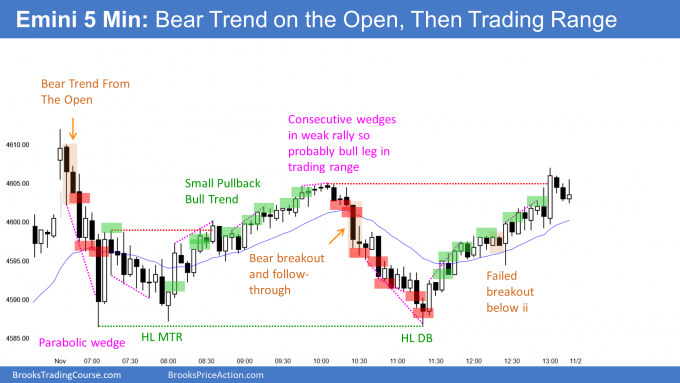
- Small gap up on the daily, weekly, and monthly charts, but it closed in the 1st hour.
- Minor reversal up from a parabolic wedge sell climax on the open. It tested the 4600 Big Round Number, Friday’s high, and the EMA.
- After a higher low double bottom (higher low major trend reversal), the bulls got a rally for a couple hours, but it failed above 4600 and Friday’s high.
- Today was a trading range day on the 5-minute chart.
- It had a small bear bar on the daily chart, and it therefore is a weak sell signal bar for a failed breakout to a new all-time high in a buy climax.
- Because the bull channel is tight and the bear body is small, this is a minor sell signal. There will probably be buyers not far below.
- Traders should expect a trading range for a couple weeks starting within a week or so, but in the meantime, the bulls will buy the 1st 1- to 3-day pullback.
See the weekly update for a discussion of the price action on the weekly chart and for what to expect going into next week.
Trading Room
Traders can see the end of the day bar-by-bar price action report by signing up for free at BrooksPriceAction.com. I talk about the detailed S&P Emini futures price action real-time throughout the day in the BrooksPriceAction.com trading room. We offer a 2 day free trial.
Charts use Pacific Time
When I mention time, it is USA Pacific Time. The Emini day session charts begin at 6:30 am PT and end at 1:15 pm PT which is 15 minutes after the NYSE closes. You can read background information on the market reports on the Market Update page.


Hi, Al
What are your thoughts on the Kelly criterion for day trading?
Their are many risk of ruin formulas, and a day trader does not have time to bother with them. Just risk less than 1- 2%. A trader should focus on taking reasonable trades and managing them well, not on mathematical equations. The variables change too quickly and can never be known with precision. This makes the formula useless for an active trader.
Hi Al,
Was wondering what your thoughts were on trading the Globex session? Are the patterns/signals just as reliable without the volume?
Sometimes I am not able to trade the day session w/ work, so was wondering if it would make sense or even be beneficial to trade the Globex for a few hours after work.
Despite the low volume, the Globex creates tradeable patterns every day. No matter how big you trade, you are not going to move the market. Institutional computers around the world are watching constantly, and they will place huge position at any time if they see an opportunity. This prevents manipulation.
As you said price action works in all the markets does it applies to crypto also can we day trade cryptocurrencies based on price action.
The volatility is very high in crypto markets in comparison with stocks. Were stock markets was also very volatile few decades before or during its initial stages.
100 years ago, stock prices were easy to manipulate, and swings were big and abrupt. That is not what is going on with bitcoin. Now, there is great uncertainty about what its value is, given that there are many variables and not much certainty about how they affect value. That means the probing up and down has to go further.
There is heavy institutional trading of bitcoin at this point, and no one person can manipulate it more than briefly. Its price action is the same as that for AAPL, bonds, the Emini, and every other major market.
thanks for the reply sir.