Trading Update: Wednesday December 1, 2021
Emini pre-open market analysis
Emini daily chart
- Yesterday was a big bear day and it broke below Friday’s low.
- Yesterday was the final trading day in November. On the monthly chart, November is a bear bar closing near its low, a monthly sell signal.
- On the monthly chart, October was an outside up month after an outside down September. That created an OO setup, which is a Breakout Mode pattern.
- The buy signal triggered when November traded above October’s high.
- But now November is a sell signal bar for a failed OO buy signal. Unless today’s big gap up leads to a strong rally over the next few days, December should trade below the November low to trigger the sell signal.
- Also, September was the 3rd attempt to reverse down on the monthly chart since the pandemic crash. It was therefore an attempt at a parabolic wedge top.
- I said at the time that there typically would be a 2nd bear bar within a couple months. November is 2 months later, and it was a bear bar, as was likely. This met the minimum objective of the bears. The bulls hope December does not go below the November low. Instead, they will try to have it go above the November high and resume the bull trend on the monthly chart.
- Is this the start of a correction? With 2 of the past 3 months having bear bodies and with the Emini turning down from the top of the bull channel on the weekly chart, traders know that there is an increased chance that December will be sideways to down.
- If there is strong selling over the next week, the selloff could test the October low. That is the bottom of a trading range that began in July, and about a 10% correction.
- As I wrote the other day, if the Emini gets there, it will probably bounce.
- But the rally would likely be a lower high. At that point, traders would begin to talk about a head and shoulders top where the September 2 high was the left shoulder.
- What is most likely over the next few weeks? How far down can this go?
- I mentioned that the selloff would probably test below the September 2 high, which is just a little below yesterday’s low. That was the breakout point of the October rally, and the Emini might still be in the trading range that began in July. When it is in a trading range, it typically tests beyond breakout points.
- That low is also at the 50-day moving average, which is another magnet below.
- A 50% correction is at 4504.00, just above the 4500 Big Round Number.
- The yearly chart closes at the end of December. I will show it in January. It is a big bull bar closing near its high. Most big bars have tails on top that come from a small reversal just before the bar closes. That is what might be happening now. But remember, a small reversal on the yearly chart can be a big reversal on the daily chart.
- I have said many times that the bears have never had more than a 50% chance of a correction since the pandemic began. That is still the case. They will need several more bear days to get the probability up to 50%. If instead there are a few bull days, the year will probably close on the high.
- As I have been saying since the pandemic low, a new high is always at least slightly more likely than a correction because of the strong bull trend on the weekly and monthly charts. That is still true today.
- However, this rally has been extreme and it should attract some protracted profit taking before too long. If December sells off, it could create a correction on the daily chart while being just a 2-bar pullback on the monthly chart.
Emini 5-minute chart and what to expect today
- Emini is up 55 points in the overnight Globex session.
- A big gap up increases the chance of a trend day. The odds are slightly greater that the trend will be in the direction of the gap (here, up).
- When there is a big gap up, the Emini is far above the EMA. Bulls do not want to pay a price that is far above average unless the bars are all above average bullishness.
- Therefore, if there is not a series of strong bull bars on the open, there will probably be an opening trading range for an hour or two. The bears will look to sell a double top or a wedge top.
- The bulls will look to buy a double bottom or wedge bottom near the EMA.
- Can today be a big bear day and trigger the monthly sell signal? It is unlikely when there is a very big gap up from a sell climax. The bears who sold yesterday will look for any selloff today to buy back their shorts with a smaller loss.
- Most likely, the strong selling over the past week will transition into a trading range for a few days. Traders will then decide whether to continue up to a new high by the end of the year or resume down to below last month’s low and trigger the monthly sell signal.
- Even if today is a trading range day, the daily ranges lately have been very big. That will probably result in at least one swing up and one swing down today.
Yesterday’s Emini setups

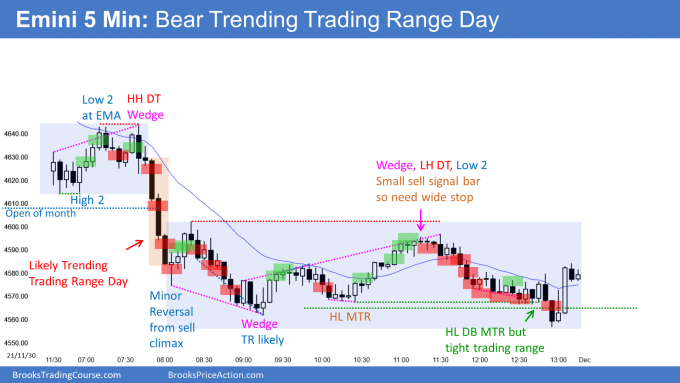
Here are several reasonable stop entry setups from yesterday. I show each buy entry with a green rectangle and each sell entry with a red rectangle. Buyers of both the Brooks Trading Course and Encyclopedia of Chart Patterns have access to a much more detailed explanation of the swing trades for each day (see Online Course/BTC Daily Setups).
My goal with these charts is to present an Always In perspective. If a trader was trying to be Always In or nearly Always In a position all day, and he was not currently in the market, these entries would be logical times for him to enter. These therefore are swing entries.
It is important to understand that most swing setups do not lead to swing trades. As soon as traders are disappointed, many exit. Those who exit prefer to get out with a small profit (scalp), but often have to exit with a small loss.
If the risk is too big for your account, you should wait for trades with less risk or trade an alternative market like the Micro Emini.
EURUSD Forex market trading strategies
EURUSD Forex daily chart

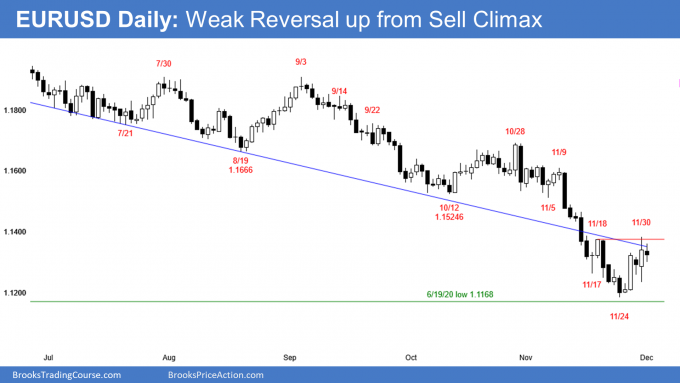
- Yesterday was a big bar with big tail above and below. It was a trading range bar. It increases the chance of a trading range over the next couple weeks. Trading ranges often have both double tops and double bottoms. A test of the November 24 low and a bounce would create a double bottom.
- Yesterday had a bull body and it followed a reversal up from a parabolic wedge and a failed breakout below the bear channel on the weekly chart. It will probably trade sideways to up for at least a couple weeks. But sideways means that it might test last week’s low before going up.
- There is an increased chance that today will remain an inside day. It would then be both a buy and sell signal bar.
- The bears hope that yesterday formed a double top bear flag with the November 18 high. They hope today to close near its low so that it would be a higher probability sell signal bar.
- They want an outside down bar on the weekly chart and a resumption of the bear trend.
- They are hoping that the 2021 bear trend falls below the last year’s low and the bottom of the 7-year trading range.
- Since the monthly chart has been in a trading range for 7 years, it is more likely that the EURUSD will enter a trading range lasting a couple months before it breaks to a new low, if it breaks to a new low. Last week might be the start of the trading range.
- The bulls want today to close near its high. They hope that last week’s reversal up is the start of a Small Pullback bull trend that will continue to the November 9 high, which is the top of the most recent sell climax. The probability will be greater if today closes near its high.
- The context on the daily and weekly charts still favors sideways to up trading for at least a couple weeks. There might be more buyers than sellers below last week’s low.
- If the bulls start to get a series of bull bars, traders will begin to look for a trading range that could last a couple months.
Summary of today’s S&P Emini futures price action and what to expect tomorrow

End of day summary
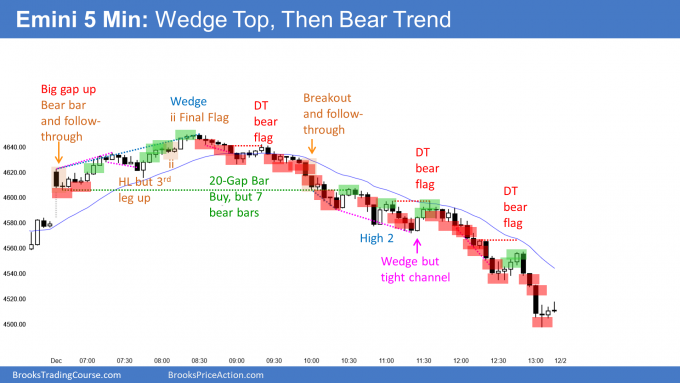
- Today began with a big gap up. That reduced the chance that the day would rally from the open and be a big bull trend day.
- It reversed down from a wedge top at just above yesterday’s high.
- The 2nd leg down from the wedge top broke strongly to below the head and shoulders top.
- It then traded below yesterday’s low to become an outside down day.
- Yesterday’s low was also the November low, and therefore the Emini triggered a monthly sell signal today for a failed breakout above the October OO. That increases the chance of lower prices in December.
- When a higher time frame sell signal triggers, there is typically a pullback above the low of the sell signal bar. If the bulls get that this week, the bears will then try a 2nd time, and hope for a bear trend on the daily chart.
- I said a few times recently that the reversal down should test the September 2 high, which was the breakout point of the October rally. Today broke below it at the end of the day.
- The Emini probably will reach other targets below over the next week. The 50% pullback is around the 4500 Big Round Number. The 150-day MA and the bottom of the bull channel a little further down. All are magnets below.
- There is a 40% chance that the selloff will continue down to the October low.
- Big Up, Big Down on the daily chart creates Big Confusion. That typically results in a trading range. The bottom of the range might be around today’s low or all the way down to the October low.
See the weekly update for a discussion of the price action on the weekly chart and for what to expect going into next week.
Trading Room
Traders can see the end of the day bar-by-bar price action report by signing up for free at BrooksPriceAction.com. I talk about the detailed S&P Emini futures price action real-time throughout the day in the BrooksPriceAction.com trading room. We offer a 2 day free trial.
Charts use Pacific Time
When I mention time, it is USA Pacific Time. The Emini day session charts begin at 6:30 am PT and end at 1:15 pm PT which is 15 minutes after the NYSE closes. You can read background information on the market reports on the Market Update page.


Hi Dr. Brooks,
I bought above Bar 15 and took profits at 2 ticks below Bar 10’s High because I assumed that if price gets back to that high, then the market might trigger a Wedge Top.
I saw that I left a lot of profits on the table because the market went a lot higher than Bar 10’s High. Was this stupid of me?
Sometimes I see a Wedge being triggered exactly at the second push’s extreme, and sometimes (like today), it goes a lot further. How do we know to hold the position for more profits?
Also, if one buys above Bar 21, where is the profit target since we’re already in the third leg of the Wedge? I did buy above Bar 21 looking for a touch of a trendline from Bar 1 High to Bar 8 High, but the market formed a micro double top and the projection was never reached. I assumed (maybe incorrectly), that this trendline would be a magnet and the bulls would form a climactic overshoot that would then be the catalyst for a reversal down, but there wasn’t a trendline overshoot. However, if I recall correctly, overshoots are more common in bear trends than bull trends right? My other thought is that the breakout distance from Bar 10’s High to Bar 24’s High is larger than the breakout distance from Bar 1’s High to Bar 10’s High, therefore the third leg is more climactic, so even if there isn’t an actual overshoot of a bull trendline, the breakout distance being more climactic may be a valid enough reason to assume a topping formation especially with a micro double top. Is there any validity to this thought?
Hi, Al.
I sometimes (like today) buy the third push down in a wedge bull flag as soon as it touches a reasonable line I plotted before (or even the close of a big bear bar) instead of waiting for a bull bar to confirm. Of course probability is much lower this way and I’ve beared losses before , also it’s very risky when it becomes a parabolic wedge. What do you think about it?
If a person does something and it is profitable and fun, it is a good thing. For me, if there is a likely reversal, the 3rd leg is probably a scalp and the reversal is a swing. I prefer to wait for the reversal.
But a strong trend is constantly trying to reverse, yet the reversals fail. I am much more willing to take a 3rd leg, or wait for it to fail and then enter in the direction of the trend.
As you mentioned in your course i will enter all of my positions at once or very small quantity and will scale in if i have any pullbacks.
but sometime after entering all at once in a swing trade there are large pullbacks.
As we have already entered 100% of our position can we consider the close of the candle is not bought and pull back are 50% thus market has transformed into range mode and add additional positions by reducing the stop loss?
My general rule is to not risk more on any trade than on any other trade. If a trader uses tighter stops, he can trade more contracts. If the context is good, that can be fine. However, if the risk is very small, so is the probability. Traders should avoid trades if the probability is much less than 40% because it becomes too difficult to make money.