Emini minor reversal down to below 2800 and the March high
I will update again at the end of the day.
Pre-Open market analysis
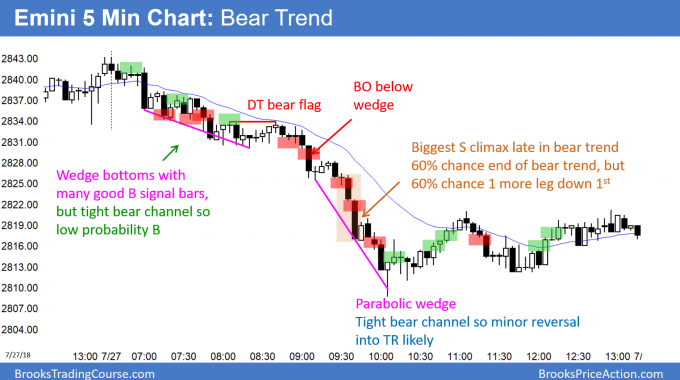
The Emini sold off from above the 2 week bull channel on the 60 minute chart to below the bottom of the channel on Friday. The selling was strong enough to make follow-through selling likely. Over the past week, I have said many times that the odds favor a 50 – 100 point correction within the next 2 weeks. It is probably underway.
Less likely, this reversal down is a failed breakout above the March high and the start of a move down to the bottom of the 6 month trading range. But, the odds favor buyers coming back below 2800 and down to the beginning of the bull channel at around 2770.
Because Friday was a sell climax, today will probably have at least a couple hours of sideways to up trading starting by the end of the 2nd hour. However, the odds favor a move below 2800 this week. The bears will sell 20 – 30 point rallies.
Overnight Emini Globex trading
The Emini is unchanged in the Globex session. Because Friday was a sell climax in a bull trend, day traders expect a lot of trading range trading today. Friday’s selloff was strong enough Surprise Bar to make a 2nd leg down likely within a couple of weeks. However, this week could retrace half or more of Friday’s selloff before the 2nd leg down begins.
Whenever there is a big day like Friday, there is an increased chance of more big days. But, because of the sell climax on Friday after Wednesday’s buy climax, there is confusion. The odds are that the next few days will be smaller and confused. That means that there will be trading range trading before there is a breakout up or down. At the moment, the breakout will more likely be down after a week or two of sideways trading. Yet, the odds are that the bulls will buy the 2nd leg down and the bull trend will continue up to a new high.
Friday’s setups
Here are several reasonable stop entry setups from Friday. I sometimes also show limit order entries and entries on the close of bars. My goal with these charts is to present an Always In perspective. If a trader was trying to be Always In or nearly Always In a position all day, and he was not in a position at the moment, these entries would be logical times for him to enter.
EURUSD Forex higher low in triangle
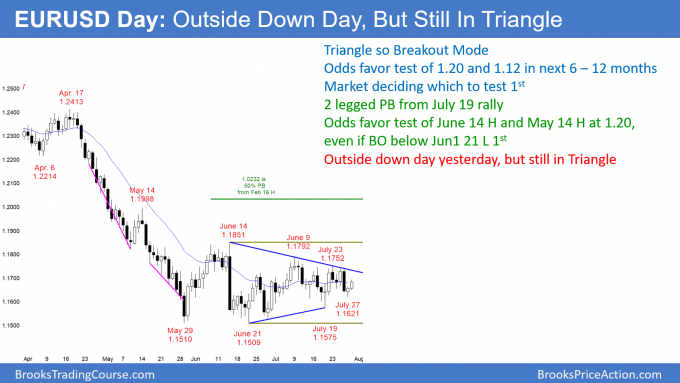
The EURUSD daily Forex chart had a small reversal up on Friday from a 2 legged pullback. Since the chart is at the apex of a 2 month triangle, a breakout attempt is likely within a couple of weeks.
The EURUSD daily Forex chart formed a higher low on Friday after the 3 day July 19 rally. Since the chart is at the apex of a triangle, the legs up and down are lasting only a few days before reversing.
When that happens, there is usually an attempt to break out of the triangle within about 10 bars. On the daily chart, that is 2 weeks. The 1st breakout has a 50% chance of reversing. In addition, when there finally is a successful breakout, there is a 50% chance it will be up or down. Also, traders will look for a measured move based on the 300 pip tall height of the triangle.
Because the triangle is late in a bear trend on the daily chart, if there is a bear breakout, the odds are that triangle will be the final bear flag. Consequently, if the selloff reaches to around the 1.12 measured move target, there would then probably be a reversal back into the triangle within several months. This would then create a larger trading range.
Overnight EURUSD Forex trading
The EURUSD 5 minute Forex chart has rallied 70 pips since Friday’s low. That is a small rally and therefore day traders are continuing to mostly scalp. The rally retraced about half of last week’s selloff. There will therefore be sellers here and just above at the 1.1700 Big Round Number. In addition, there will be buyers around the overnight higher low around 1.1650.
Since the daily chart is at the apex of a 2 month triangle, the odds are that there will soon be a breakout attempt. Consequently, while day traders are scalping, they expect a series of trend days soon. Once they begin, the day traders will resume swing trading.
Summary of today’s S&P Emini futures price action and what to expect tomorrow
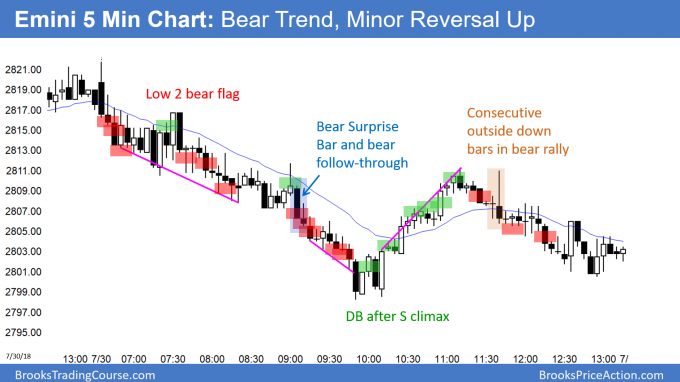
Here are several reasonable stop entry setups for today. I sometimes also show limit order entries and entries on the close of bars. My goal with these charts is to present an Always In perspective. If a trader was trying to be Always In or nearly Always In a position all day, and he was not in a position at the moment, these entries would be logical times for him to enter.
The bears had another Small Pullback Bear Trend today. But, the bulls got a reversal up from the 2800 Big Round Number and the 20 day EMA. The odds favor sideways to up for 2 – 3 days. However, the 2 day selloff was a Surprise reversal. Therefore, the bears will probably get at least a small 2nd leg sideways to down over the next week or two.
Tomorrow is the last day of the month. The major monthly support is the March high and the June high. Both are around 2800.
See the weekly update for a discussion of the price action on the weekly candlestick chart and for what to expect going into next week.
Traders can see the end of the day bar-by-bar price action report by signing up for free at BrooksPriceAction.com. I talk about the detailed S&P Emini futures price action real-time throughout the day in the BrooksPriceAction.com trading room. We offer a 2 day free trial.
When I mention time, it is USA Pacific Standard Time (the Emini day session opens at 6:30 am PST, and closes at 1:15 pm PST). You can read background information on the intraday market reports on the Intraday Market Update page.


