Posted 6:54 a.m.
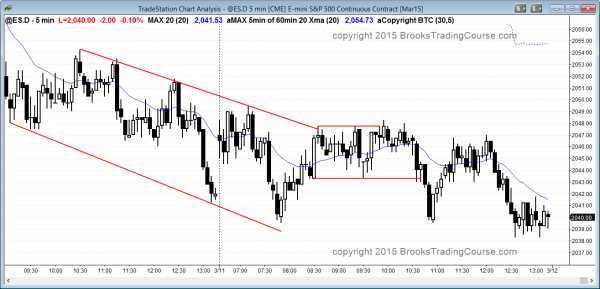
Today opened with a doji within yesterday’s tight trading range. Yesterday was in a broad bear channel, which usually evolves into a trading range, and the day was mostly within a tight trading range. There are targets below and above. This increases the chances of a trading range day. Until there is a strong breakout up or down with follow-through, traders will mostly scalp, look to buy reversals up from bear breakouts and to sell reversals down from bull breakouts. However, there are 60 minute targets above and below and the market might trend. It usually will have at least one strong swing trade, and traders need to be prepared to trade it.
At the moment, the Emini is sill always in short from yesterday’s broad bear channel, but it is in a tight trading range and in breakout mode. Most traders should wait for the breakout. Bulls need a breakout above yesterday’s lower highs to convert this from a broad bear channel into a trading range or a bull trend.
My thoughts before the open: Trading range after the trend channel
Yesterday had a strong rally early in the day and it was strong enough to make an attempt at a major trend reversal today likely. However, most successful major trend reversals create a larger trading range, even though the rally can last for a day or more. Traders learning how to trade the markets need to be aware that the bear trend channel can last much longer than what seems reasonable, and that a broad bear channel can unexpectedly have a bear breakout. When that happens, the market is back in the breakout phase of the market cycle.
Yesterday’s broad bear channel has not yet had a bull breakout, and there still is the magnet of the 60 minute bull trend line below. However, channels usually evolve into trading ranges, and the Emini might do that today before continuing down to that trend line. The 100 day moving average is also just below, and it is near that bull trend line. The bear channel might first evolve into a trading range before it falls to the targets below, although it will probably reach those targets this week.
Summary of today’s price action and what to expect tomorrow
Although today was a trading range day, it was also a continuation of the broad bear channel. There were still lower highs and lows.
The 60 minute chart is just below the bottom of its bear channel, but every reversal attempt on the 5 minute chart has failed to get above a prior lower high. The bear channel is continuing. The 100 day moving average on the daily chart and the bull trend line on both the daily and 60 minute charts is around 2035, which is close enough so that the market probably cannot escape the gravitational pull of these magnets. The odds favor a test of them tomorrow.
The bulls want a reversal up from support and the bears want the broad bear channel to have a bear breakout. They hope that the bear breakout would be the start of another leg down in what they hope is a trend down on the daily chart. I have posted many times that the monthly chart is extremely overbought and that a 20% correction is likely this year. There have been many reversal attempts over the past year and all have failed. It is too early to know if this is the start of a bear trend on the daily chart, but with the monthly chart as overbought as it is, a bear trend on the daily chart will probably come at some point this year.
For tomorrow, there should be a test of the 2035 area. Bulls will look for a reversal up and bears will look for a strong breakout below. Since the 60 minute chart is oversold, the odds favor at least a bounce for a day or two. The weekly chart is also at the weekly moving average, which was support in December and January. If this is a bear market, and no one knows if it is yet, support will not stop it and there will be many surprisingly big breakouts below what should be strong support. Be ready because it might happen soon.
See the weekly update for a discussion of the weekly chart and for what to expect going into next week.
Traders can see the end of the day bar-by-bar price action report by signing up for free at BrooksPriceAction.com. I talk about the detailed Emini price action real-time throughout the day in the BrooksPriceAction.com trading room, and a 2 day free trial is available.
When I mention time, it is USA Pacific Standard Time (the Emini day session opens at 6:30 am PST, and closes at 1:15 pm PST). You can read background information on the intraday market reports on the Intraday Market Update page.


Great update. Thank you