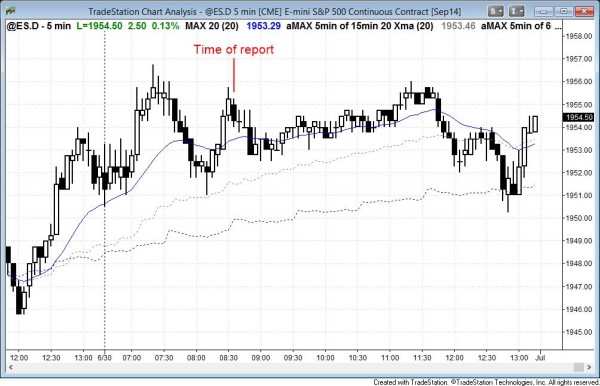
This chart was posted after the close. It shows that the day continued as a trading range day, as was likely to be the case.
This report was posted at 8:35 am PST.
The key feature in today’s intraday update is the trading range price action. Today is the last day of the month so today affects the appearance of the candle pattern on the monthly chart. Support and resistance magnets include the high and low of the month. The midpoint of the month is also important because a close below the middle of the month’s range creates a reversal bar. Although it is not very bearish unless it is also a bear candle, it is a sign of selling pressure.
Last week was a doji bar on the weekly chart with a close near its high. Since a doji is a one bar trading range and it closed near the top, the market might test lower this week. However, June 30 – July 5 is up almost 80% of the time so traders should only take shorts that look especially strong.
The market opened with a tight trading range, which became a final flag. It also tells us that there is no urgency and that the day might be a trading range day.
The selloff to the double bottom at 8:10 am PST had 5 consecutive bear bars, which erased the bullishness of the early rally. The breakout from the double bottom had 4 consecutive bull bars with closes near their highs. The bulls want a breakout to a new high of the day and then a measured move up, and the bears want a lower high major trend reversal and a measured move down. Because of the repeated reversals, the odds favor a trading range day. However, be ready for a breakout up or down and a trend, although it is unlikely at the moment.
Traders can see the end of the day bar-by-bar report by signing up for free at BrooksPriceAction.com. I talk about the detailed Emini price action real-time throughout the day in the BrooksPriceAction.com trading room, and a 2 day free trial is available.
I sometimes refer to bar numbers (there are 81 five minute bars each day) instead of times on the 5 minute. When I mention time, it is USA Pacific Standard time (the market opens at 6:30 am PST, and closes at 1:15 pm PST). Background information on this report can be read on the Intraday Market Update page.

