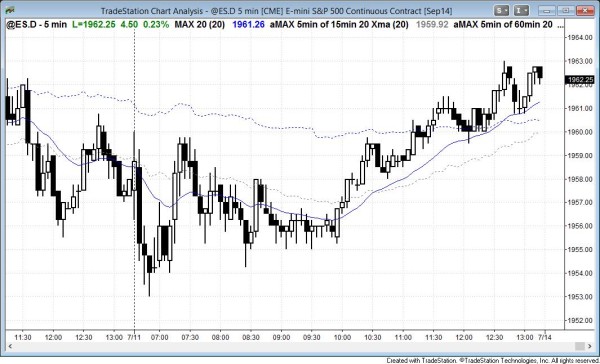
The Emini was in a triangle for the first three hours of the day and then had a bull breakout. The bulls wanted a second leg up after the strong reversal up yesterday from the failed breakout below last week’s low.
Posted 7:41 am PST.
The key feature in today’s intraday update is the test of last week’s low, which was a sell signal bar. The S&P 500 stock market index is deciding whether the wedge top on the daily chart and the reversal down from the top of the weekly channel will lead to a pullback to the nearest support below. This is around 1900, and it is the breakout point of the 3 month trading range that ended in May, the nearest weekly bull trend line, and the bottom of the wedge. The stock market instead might get one more new high before turning down because yesterday was the first breakout below a 10 bar (10 week) bull microchannel on the weekly chart and the stock market usually needs a second signal before it forms a trend reversal.
Yesterday had a spike and channel bull trend and the market tested the bottom of the channel and formed a trading range for the first hour. The rally to 7:20 probably was strong enough so that bulls will buy a pullback, hoping for a higher low and a second leg up. The market is always in long, but it is continuing yesterday’s trading range so far.
If the market is within 5 points of last week’s low of 1950.25 in the final hour, it will probably test that level. Less likely, it might test the open of the week around 1973. At the moment, a trading range day is likely, and the market will probably have a hard time getting far from last week’s low. Traders will buy low, sell high, and scalp. If the market gets a strong breakout up or down, traders will switch to trend trading.
At the moment, the bears want a double top with 12:45 pm PST yesterday and then a bear breakout to last week’s low, but a trading range is more likely.
Traders can see the end of the day bar-by-bar report by signing up for free at BrooksPriceAction.com. I talk about the detailed Emini price action real-time throughout the day in the BrooksPriceAction.com trading room, and a 2 day free trial is available.
I sometimes refer to bar numbers (there are 81 five minute bars each day) instead of times on the 5 minute. When I mention time, it is USA Pacific Standard time (the market opens at 6:30 am PST, and closes at 1:15 pm PST). Background information on this report can be read on the Intraday Market Update page.

