Posted 6:50 a.m.
Yesterday ended with a sell climax and a brief strong rally. The bulls are hoping for a major trend reversal up. However, because the 60 minute wedge top is clear and in an overbought 60 minute and daily chart, any rally on the 5 minute chart will probably form a major trend reversal top on the 60 minute chart.
Most days over the past month have begun with trading ranges that have lasted about an hour. Yesterday ended with a trading range and it might continue. There was enough buying pressure at the end of yesterday and the start of today to make a rally likely. There might be some follow-through selling, but the odds favor a couple of hours of sideways to up trading before the 60 minute bars try for their 2nd leg down.
Yesterday was a sell signal bar on the daily chart, but it was a doji and it followed 10 bull bars. This makes it a bad sell setup and means that there will probably be buyers below yesterday’s low.
Although yesterday ended with an attempt to become always in long, it was not strong enough. However, there was enough buying pressure to make a 2 hour rally likely today, and to make bears hesitant to sell too low, unless there is a strong bear breakout with follow-through. The bears might get a swing trade in the 2nd half of the day. The bulls have a chance for a swing trade up within the first hour or two.
My thoughts before the open: 60 minute wedge top so an ABC pullback is likely
Yesterday triggered a sell from a 60 minute wedge top so an ABC pullback is likely. This means that the 60 minute chart should begin to have a 2nd leg down after any bounce today. The pattern is big, and there is a wedge on 2 – 4 hour charts as well, so the TBTL Ten Bars, Two Legs down will probably form on those charts, not simply on the 60 minute chart. I always look at the highest time frame where the pattern is still clear, and I then look for TBTL on that time frame.
Since the market had 10 consecutive bull trend days, it is strong and it is more likely to enter a small trading range, maybe even for a month, than it is to go straight down from here. Although is could continue up, the 60 minute wedge top makes sideways to down more likely for at least several days.
Summary of today’s price action and what to expect tomorrow
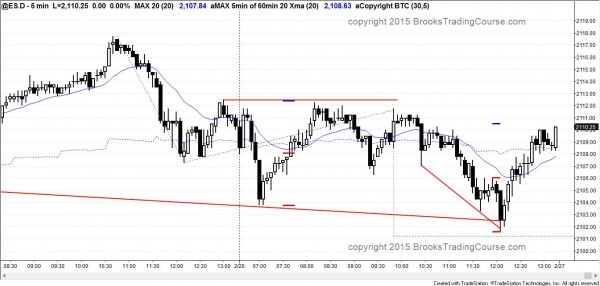
The Emini traded below yesterday’s low on the open and reversed up from a lower low major trend reversal. It failed 2 more times to get above the top of the trading range from the end of yesterday and then broke below a bear triangle. It reversed up from the low of the day and from 2 trend channel lines.
Today was likely to trade below yesterday’s low because yesterday’s candle on the daily chart was a sell signal. However, the rally of the past 3 weeks has been so strong that it was likely to create buyers below yesterday’s low. After a brief selloff, the bulls reversed the market up from a lower low major trend reversal.
The bulls twice tried and failed to break above the trading range. The market then tried the other direction and fell to a new low of the day. The selloff had bad follow-through all of the way down, which made it more likely a bear leg in a trading range. Bulls were finally able to buy a reversal up, which tested the apex of the triangle.
The bulls hope that this reversal and the 60 minute gap bar (high below the moving average) results in a resumption of the bull trend. However, traders who are learning how to trade the market should remember that a gap bar usually leads to the final rally before a major trend reversal down triggers. The bulls want to break strongly above the trading range. The bears want a double top at the top of the range and then a 2nd leg down on the 60 minute chart after yesterday’s wedge top triggered.
Tomorrow is Friday and weekly magnets can be important. The low of the week is 2099.75 and the open of the week is 2104.50. Last week’s high is 2108.75.
Tomorrow is also the last trading day of the month. The only magnet that is close is the December high of 2088.85.
See the weekly update for a discussion of the weekly chart and for what to expect going into next week.
Traders can see the end of the day bar-by-bar price action report by signing up for free at BrooksPriceAction.com. I talk about the detailed Emini price action real-time throughout the day in the BrooksPriceAction.com trading room, and a 2 day free trial is available.
When I mention time, it is USA Pacific Standard Time (the Emini day session opens at 6:30 am PST, and closes at 1:15 pm PST). You can read background information on the intraday market reports on the Intraday Market Update page.


