Posted 6:46a.m.
The Emini has had tight trading range trading and a limit order market for the first hour or so for most of the opens over the past several weeks, and today is another example. After an extreme buy climax on the 5 minute chart and 9 consecutive bull bars on the daily chart, the odds are against a bull trend day today. However, it is still possible.
More likely, today will be a small trading range day. If there is a strong breakout with follow-through in either direction, swing traders will hold part of their positions. Without that, traders will be quick to take profits and they will expect that most breakout attempts will fail. If there are strong reversals, they will enter. If a reversal is not as clear, they will wait for a 2nd entry or a breakout in the opposite direction. Even though the odds favor more trading range trading, traders always need to be prepared for the less likely possibility…a strong trend day in either direction.
At the moment, the Emini is still always in long after yesterday’s strong close, and there are weekly measured move targets 2 – 4 points above yesterday’s high. If the market hits those targets, be prepared for a reversal down, especially since today will probably close below the open of the day. Be open to the possibility that today could still become a bull trend day, even though that is not likely.
My thoughts before the open: Pullback in a buy climax
The Emini has had 9 consecutive bull candles on the daily chart, which is extremely unusual, so the odds favor a close below the open today. That does not mean a bear trend day because it can happen with a small doji day. Yesterday was a small day and today probably will be another one. A strong bull day is unlikely when the market is so overbought on the daily and 60 minute charts.
Although the Emini is overbought on all time frames and it will probably have a 20% correction this year, and the correction will begin from an all-time high, which is where the market currently is, most reversal attempts will fail. The daily chart has been in a broad bull channel for about a year. This means the bears are selling new highs profitably and the daily chart is beginning to evolve into a trading range.
The monthly bull trend is so strong that even a 400 point selloff will probably just be a pullback in the bull trend. However, 400 points would be a bear trend on the daily chart and it could last for 4 months to a year, as the monthly bull flag develops.
The past 2 days of price action are similar to September 13 and 14, 2012, where the market had a buy climax and some follow-through buying at a new high, but the market then sold off and did not get back to that high for 4 months. Is that what is going on now the same? Picking tops in a bull trend is a losing strategy because most become bull flags. When traders are learning how to trade the markets, they gravitate to reversals because the risk is small. They neglect that small risk always comes with low probability.
However, the context is good and traders should not be committed to only one direction. It is important to be prepared for a sharp reversal on the daily chart at any time because risk happens fast.
Summary of today’s price action and what to expect tomorrow
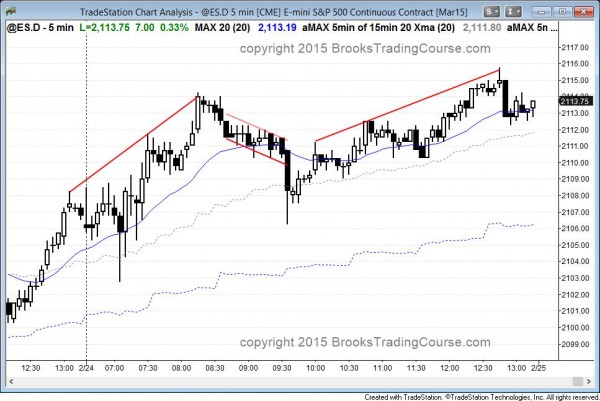
Today was a weak bull trend day with several wedges. It was the 10th consecutive bull bar on the daily chart.
After 10 consecutive bull bodies on the daily chart, which has not happened in years, tomorrow will probably have a bear body. However, because the Emini has been so strong, a trading range day with a bear close is more likely than a bear trend day.
See the weekly update for a discussion of the weekly chart and for what to expect going into next week.
Traders can see the end of the day bar-by-bar price action report by signing up for free at BrooksPriceAction.com. I talk about the detailed Emini price action real-time throughout the day in the BrooksPriceAction.com trading room, and a 2 day free trial is available.
When I mention time, it is USA Pacific Standard Time (the Emini day session opens at 6:30 am PST, and closes at 1:15 pm PST). You can read background information on the intraday market reports on the Intraday Market Update page.


