Posted 6:54 a.m.
The Emini opened in the middle of yesterday’s range, and yesterday was a trading range day. Most of the days of the past several weeks began with a tight trading range that lasted about an hour, and today is similar. The gap down might be all of the correction that the bears will get from Friday’s buy climax. Traders are scalping, and they will wait for a breakout in either direction with follow-through before they begin to swing trade. The target above is Friday’s high, which is the all-time high, and the target below is the gap up from last week, which is at 2069.75. The market is deciding which it will test. With the 60 minute chart overbought, the odds favor a limited upside, and a test down soon, but swing traders are willing to buy if there is a strong bull breakout.
At the moment, the Emini is always in short from the consecutive bear bars on the open, but the market is back in the middle of yesterday’s trading range and is probably neutral, waiting for a breakout.
My thoughts before the open: Breakout or a failed breakout
The Emini will chose over the next few weeks between a breakout and a failed breakout above the December all-time high. As you know, I believe that the monthly chart is unusually overbought. However, as I have said many times, it might get much more overbought before it has a 20% correction, which I believe will happen this year. There is enough of a channel on the weekly and daily charts to make bears comfortable scaling into shorts as the rally continues. The last several breakouts to new highs were followed by pullbacks below the prior high, and both bulls and bears believe this will happen again, even if the bull trend continues.
Friday ended with a 2 hours buy climax, and that means there is a 70% chance of at least a 2 hour, 2 legged correction at some point today starting within the first hour or two. The 60 minute chart is also overbought, which increases the chances of a pullback today or tomorrow. The first target is the 60 minute moving average, and then possibly the gap at 2069.75.
Summary of today’s price action and what to expect tomorrow
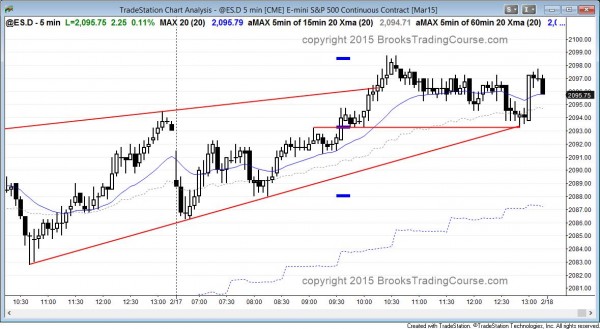
The Emini had an opening reversal up from the 15 minute moving average and a strong enough first leg up to establish the trend for the day. It reversed down from a buy climax midday, and spent the rest of the day in the upper trading range of what became a trending trading range day.
The Emini made another all-time high today, but it did so with a climactic rally. It is at the top of a 60 minute wedge, and the 60 minute chart has had a series of buy climaxes without a significant pullback. The odds favor a test of the bottom of the channel and the 60 minute moving average tomorrow. Both are rising and both are around 2087. The Emini might test the gap from last week at 2070 at some point this week. The top of the daily bull trend channel is around 2125, but since the 60 minute chart is so overbought, there will probably be a pullback before the Emini gets there.
See the weekly update for a discussion of the weekly chart and for what to expect going into next week.
Traders can see the end of the day bar-by-bar price action report by signing up for free at BrooksPriceAction.com. I talk about the detailed Emini price action real-time throughout the day in the BrooksPriceAction.com trading room, and a 2 day free trial is available.
When I mention time, it is USA Pacific Standard Time (the Emini day session opens at 6:30 am PST, and closes at 1:15 pm PST). You can read background information on the intraday market reports on the Intraday Market Update page.


