Emini failed breakout above January high and 2900
I will update again at the end of the day.
Pre-Open market analysis
Yesterday gapped up to another all-time high, but sold off back into Monday’s tight trading range. Since it was a bear bar on the daily chart, it is a sell signal bar for today. The bears want a failed breakout above the January high.
Their 1st goal is to get back below the 2884 January high. A more important goal is to close the gap above Friday’s high. The bulls always want the opposite and they will buy just above that 2877.25 high. The Emini will probably test one or both of these support levels this week. It will then decide between trend resumption up or trend reversal down. Up is more likely.
The 3 week bull channel on the daily chart is tight. The bears therefore will probably need at least a micro double top before they can get a swing down. But, the 1st reversal down will probably only last 1 – 2 days.
Overnight Emini Globex trading
The Emini is down 1 point in the Globex session. After Monday’s gap up to a new all-time high, the odds favor 2 – 4 trading range days. Since yesterday was a trading range day, today will likely be another. However, because the Emini is at a major prior high, there is an increased chance of a big trend day up or down.
Yesterday’s setups
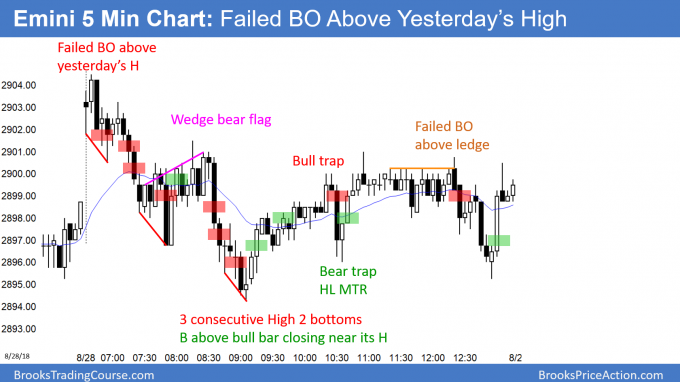
Here are several reasonable stop entry setups from yesterday. I sometimes also show limit order entries and entries on the close of bars. My goal with these charts is to present an Always In perspective. If a trader was trying to be Always In or nearly Always In a position all day, and he was not in a position at the moment, these entries would be logical times for him to enter.
EURUSD Forex parabolic wedge buy climax at resistance
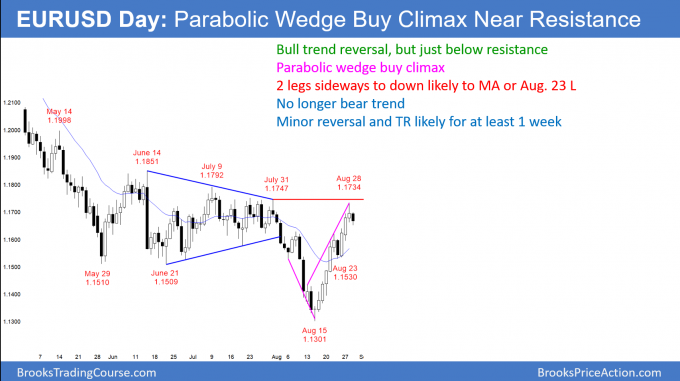
Yesterday’s reversal was a 3rd leg up from the August 15 low. The 3 week rally was in a tight bull channel and therefore it is a parabolic wedge.
The EURUSD daily Forex chart had a 3 legged rally in a tight bull channel. This is a parabolic wedge buy climax. Two small legs sideways to down over the next week are likely.
The rally came from a parabolic wedge sell climax. Trend reversals usually have a transition when there are elements of both a bull and bear trend. For example, the 1st leg up in the August 15 parabolic wedge bottom began before the final low. This is common.
The rally is strong enough to have one more leg up before there is exhaustion. But, it has met the minimum goal. In addition, it is just below the July 31 major lower high and at the 20 week EMA resistance. Furthermore, the daily chart has been oscillating around 1.17 for 4 months, so that is also resistance.
The daily chart has probably entered a trading range, especially since it is back in the middle of a 4 month range. While there might be another minor high this week, the chart will probably be sideways for at least a week or two. Traders will sell rallies, buy selloffs, and take quick profits.
Overnight EURUSD Forex trading
The EURUSD 5 minute Forex chart sold off 70 pips overnight. I said yesterday that the trading range would probably be about 150 pips tall. Obvious support is the 20 day EMA, the August 23 low just above 1.15, and he June 21 low.
When the daily chart enters a trading range, the lower time frame charts begin to have smaller bars and lots of small trading ranges. Day Traders will be quick to take profits. However, there will be 30 – 50 pip day trades from minor support and resistance on the daily and 60 minute charts.
Summary of today’s S&P Emini futures price action and what to expect tomorrow
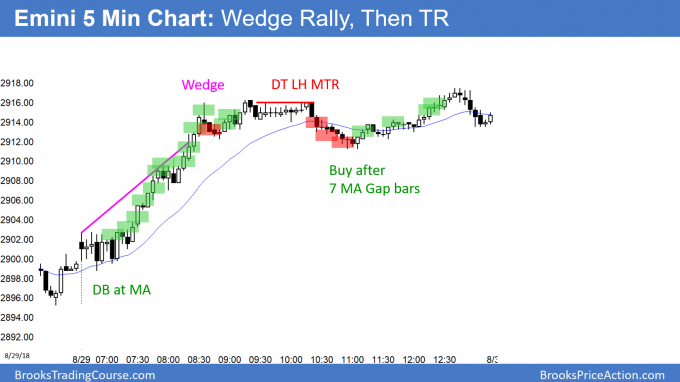
Here are several reasonable stop entry setups for today. I sometimes also show limit order entries and entries on the close of bars. My goal with these charts is to present an Always In perspective. If a trader was trying to be Always In or nearly Always In a position all day, and he was not in a position at the moment, these entries would be logical times for him to enter.
The Emini rallied strongly to a new all-time high. However, the 2 day trading range on the 60 minute chart is a possible Final Bull Flag. In addition, this rally is extreme and therefore climactic. This increases the odds of a 1 – 2 day pullback soon. However, the bull trend is intact and higher prices are likely.
See the weekly update for a discussion of the price action on the weekly candlestick chart and for what to expect going into next week.
Traders can see the end of the day bar-by-bar price action report by signing up for free at BrooksPriceAction.com. I talk about the detailed S&P Emini futures price action real-time throughout the day in the BrooksPriceAction.com trading room. We offer a 2 day free trial.
When I mention time, it is USA Pacific Standard Time (the Emini day session opens at 6:30 am PST, and closes at 1:15 pm PST). You can read background information on the intraday market reports on the Intraday Market Update page.


Hi Al,
would you explain the significance of ‘ 7 MA Gap bars ‘, what is the rationale for it to be a buy setup. Thank you
When the market is in a strong bull trend, the bulls will buy the 1st time that the bears do anything. I talked about this in the chat room today. They buy the 1st time there is a bear bar, the 1st time a bar falls below the low of the prior bar, the 1st pullback to the EMA, and the 1st time the bears put bars completely below the EMA (gap bars). They bet that the 1st reversal of every type will fail.
John, I’ll step in for Al, as this is a something he’s noted before, including in the course Video 18C, about 4:00, Slide 5, which I just happen to be watching now —
Per Al, “it does not matter that the 1st push up of the wedge began before the final push down of the bear trend — that is very common”
So in the EURUSD chart above, the 1st leg up is the single bar 2 days before the Aug 15 low.
Regards, Charles
Yes, that is correct. Bull trends often begin before bear trends end. There is usually a transition period when they alternate control for many bars.
Thanks for the details. This is so helpful to be able to ask questions. I realized why I wasn’t seeing the first leg. My daily chart does not show that bull candle. Mine shows a doji. I’ll go search for how you set up your charts and see if I can change my charts to reflect the same candles. Most of them are the same but there are a few differences.
I love the course.
Hey Charles, do you know where in the content I can find out how to set up my candles so they mirror what I’m seeing on Al’s Tradestation? I am using Tradingview and the candles are based on the New York Close. My broker shows the candles based on the mid point between ask/bid. On Aug 13th on the daily chart for EUR/USD I show a bear doji bar, not a bull bar. Most of the other candles look the same. Is it possibly a difference between Tradingview and Tradestation? Hoping you can give me a tip of what to try next. Thanks in advance for your help.
– John
John, sorry, I don’t know.
No worries. Thank you for responding.
Hey Al, Thanks as always for these daily updates. If it’s possible to respond could you elaborate on this phrase from your EUR/USD analysis. “For example, the 1st leg up in the August 15 parabolic wedge bottom began before the final low. This is common.” Where did it start up. I’m unable to spot that first leg up before the low. My sincere thanks for all the help you give everyone you teach. – John
Hi John,
Allow me to answer for Al. You can see the first low just 2 bars before the August 15 low. The wedge magenta line starts from its high.
Hello BTC Admin. Thanks for making time to answer my question. Al and Charles addressed that first question a little earlier too. The most recent question I had posted was “do you know where in the content I can find out how to set up my candles so they mirror what I’m seeing on Al’s Tradestation? I am using Tradingview and the candles are based on the New York Close. My broker shows the candles based on the mid point between ask/bid. On Aug 13th on the daily chart for EUR/USD I show a bear doji bar, not a bull bar. Most of the other candles look the same. Is it possibly a difference between Tradingview and Tradestation? Hoping you can give me a tip of what to try next. The only way I’ve been able to create a bull bar on Aug 13th is to change to 12:00 a.m. close but that creates a 6th daily candle which from what I understand I don’t want. Thanks in advance for your help.”
If you can give me any recommendations on this I would sincerely appreciate it.
Sincerely,
John Brown
Hello,
Al has talked about this many times in the past about brokers having slightly different candles. This is especially true in forex markets since there is no central exchange, nobody really knows what the real last trade was. With that said if what you see is only slightly different dont worry about it and just use the chart you have. I would just leave yours the way it is.
Awesome. That makes sense, especially in the forex market. Thanks for taking a moment to help me figure it out.
Hi John,
Sorry for wasting your time on that response. The comment link took me to see half your latest message above, and all I responded to was the old message below!!
Ref your charting query, as Brad notes, you cannot really do anything about it. Most data providers use sampled data so you only get a snapshot of the price every time the data stream is sampled. For example, Interactive Brokers sample the ES futures every 250 milliseconds. So imagine what can happen in the majority time of 750 milliseconds for every second! I get full tick data for my trading from CQG and my prices will often be a tick or two different to Al’s for the open or close. I do not bother looking intraday as I use a tick chart.
If you really wanted to get exactly the same as Al’s chart you would need to use TradeStation. Even then, depending where you are on planet earth, it still could be a tick or two different at times. And even Al notes at times that refreshing his data can result in small changes to chart.
So, as Brad notes, no need to worry. Just trade the chart you have in front of you (another common Al quote) and stop getting yourself fussed. Get on with making money!
Hope that helps.
Thank you again for the response. After yours and Brad’s responses I tried comparing a couple of different brokers’ daily charts and found the bull candle on two of the other US forex exchanges.
The quality of dialogue, education and feedback on this site is excellent. My sincere appreciation.
John