Emini double top and outside down sell signal bar
Updated 6:42 a.m.
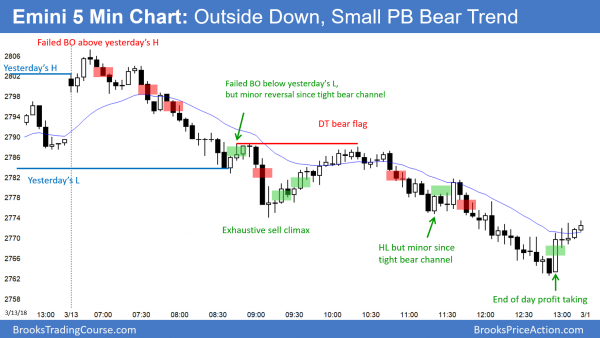
The day began with a gap up above the 60 minute moving average, far above yesterday’s low. This greatly reduces the chances of a big selloff far below yesterday’s low. It therefore makes a trading range day or a bull reversal day likely.
The 1st bars were bear bars, but the 7 bar rally up from yesterday’s low has been in a tight bull channel. In addition, the bars are testing the support at yesterday’s close and the moving average. This reduces the probability of a strong initial selloff without 1st going sideways.
While the odds favor an early test of yesterday’s close and low, there will probably be buyers there. Therefore, traders will look for a reversal up from above yesterday’s low at some point in the 1st hour. Less likely, this selloff is making an early high of the day and today will be a strong bear trend day.
Pre-Open market analysis
The Emini yesterday traded above Monday’s high and below Monday’s low. It was therefore an outside down day. In addition, Monday was a sell signal bar for a failed breakout above the February 27 high. Hence, by trading below Monday’s low, yesterday triggered a sell signal on the daily chart.
Yet, most traders will not sell as a bar goes outside down unless the setup is very strong. This is not. Some will sell below the outside down day. Therefore, this makes yesterday a sell signal bar for today. However, the weekly chart triggered a buy signal on Monday. Consequently, most bears will not sell on a stop below yesterday’s low. They will wait to see if there is a strong bear breakout and then sell.
It is important to note that Monday traded above last week’s high. Hence, this week triggered a buy signal on the weekly chart. Having a sell signal on the daily chart and a buy signal on the weekly chart generates confusion.
Traders therefore need more information before deciding if the breakout will succeed of fail. That information can come on the daily chart from a 2nd buy or sell signal, or from a strong rally or selloff. Until then, the odds favor trading range trading.
Outside bar increases chance of inside day
When there is an outside down bar in a trading range, the next day usually mostly overlaps that bar. If today stays above yesterday’s low on the open, there will be an increased chance of an inside day today.
Furthermore, since today will probably mostly overlap yesterday, if today opens near yesterday’s low, today will probably form the low of the day in the 1st hour. Therefore, day traders will look for a swing buy setup early from above or below yesterday’s low.
If instead today breaks strongly below yesterday’s low, traders will wonder if the breakout on the daily chart has failed. They will therefore look to swing shorts, At the moment, it is more likely that today will overlap yesterday.
Overnight Emini Globex trading
The Emini is up 7 points in the Globex market. Since yesterday was a sell climax, there is a 50% chance of a sideways to up move beginning within the 1st 2 hours. Furthermore, the buy signal on the weekly chart is stronger than the sell signal on the daily chart.
Consequently, it is more likely that yesterday was a pullback from a breakout above the February 27 high than the start of a reversal down. The bulls want to reverse up strongly today to make it clear. However, if today and tomorrow are also strong bear trend days, the probability will favor the reversal.
Because there are opposite signals on the daily and weekly chart, there is uncertainty. Uncertainty increases the odds of sideways trading. This means that the 3 day trading range will probably continue today.
Yesterday’s setups
Here are several reasonable stop entry setups from yesterday. I sometimes also show limit order entries and entries on the close of bars.
EURUSD Triangle in middle of 3 month trading range
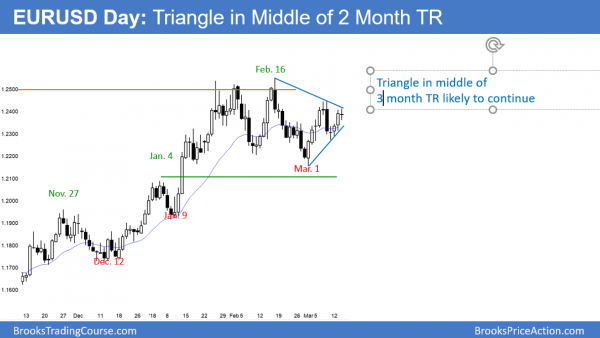
The EURUSD daily Forex chart has been sideways for 3 months. It has formed a triangle over the past month.
The EURUSD daily Forex chart is in a month-long triangle in the middle of a 3 month trading range. Hence, it is in Breakout Mode. The 1st attempt to break out of a triangle fails 50% of the time. In general, the successful breakout has a 50% chance of being up or down. Since the weekly chart is in a bull trend, the probability for the bulls is about 55%.
Whenever a market is in Breakout Mode, it always looks like its about to break out. However, in a couple days, it looks like it will break out in the opposite direction. There is no breakout until there is a breakout. Most traders scalp until there is a clear breakout. They then switch to swing trading and look for a measured move.
Since the triangle and trading range are 300 pips tall, traders are expecting a 300 pip move up or down. Furthermore, since the market is now at the apex, the breakout could begin within a week or two.
Since trading ranges resist change, it is always more likely for the range to continue to grow. This means that is it more likely that the triangle will simply evolve into another pattern within the range. Yet, the triangle increases the odds of a breakout soon.
Overnight EURUSD Forex trading
The EURUSD 5 minute Forex chart has been in a 40 pip range overnight. Since it is at the apex of a triangle on the daily chart, there is an increased chance of a breakout up or down. Yet, until there is a clear, strong breakout, Forex day traders will continue to scalp.
Summary of today’s S&P Emini futures price action and what to expect tomorrow
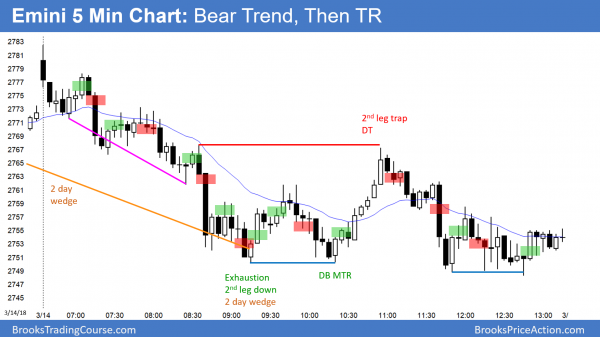
The Emini gapped up but sold off for the 1st half of the day. It then entered a trading range.
Despite gapping far above yesterday’s close, today sold off for the 1st half of the day. It went sideways for 4 hours. The bears want trend resumption down tomorrow and the bulls want trend reversal up.
There is a 2 day wedge bull flag, but the bulls need a strong bull breakout tomorrow. Otherwise, the selloff will likely continue down after yesterday’s sell signal on the daily chart.
There are 2 days left to the week. This week is a buy entry bar on the weekly chart. It currently has a bear body. If this week closes near the week’s low on Friday, this week will be a sell signal bar on the weekly chart.
See the weekly update for a discussion of the price action on the weekly candlestick chart and for what to expect going into next week.
Traders can see the end of the day bar-by-bar price action report by signing up for free at BrooksPriceAction.com. I talk about the detailed S&P Emini futures price action real-time throughout the day in the BrooksPriceAction.com trading room. We offer a 2 day free trial.
When I mention time, it is USA Pacific Standard Time (the Emini day session opens at 6:30 am PST, and closes at 1:15 pm PST). You can read background information on the intraday market reports on the Intraday Market Update page.


