Emini double top leading to 5% correction
Updated 6:44 a.m.
The Emini opened with a big gap down, but it had a strong bull bar. This reduces the chances of a big bear trend day. In addition, it increases the odds that a 2 hour sideways to up move will begin in the 1st hour. Because the 2nd bar was a bear bar, the odds of a huge bull trend day are less. This uncertainty increases the chance that today will be a trading range day. This means that it will probably have at least one leg up and one down.
The bars are big so traders need to trade small. If they cannot trade small enough, they need to wait for smaller bars.
Pre-Open market analysis
Friday’s selloff was strong enough so that the odds favor a 2nd leg down on the daily chart after the 1st bounce. However, since Friday was already a 2nd leg down after a small 1st leg, it is possible it is a 2nd Leg Trap in a bull trend. If so, the bull trend on the daily chart could resume today or tomorrow. More likely, the selling will probably continue at least until the Emini reaches the 20 week exponential moving average, which is now below 2700.
Since Friday was a sell climax, there is only a 25% chance that today will be a 2nd big bear day. However, traders should sell rallies at least until there is 2nd leg down on the daily chart and the Emini falls to the 20 week exponential moving average. Consequently, investors should wait to buy. Since the daily chart might be in a 2nd Leg Trap, traders should quickly switch to bullish if there is a strong reversal up. The odds favor the bulls over the next few months.
If the bears get a consecutive big bear day today, the daily chart will be in a bear trend. This is not likely. Yet, even if the selloff reaches 10%, it will still be a bull flag on the monthly chart and a good buying opportunity.
Since the weekly chart is close to the 20 week EMA, it is more likely that this selloff will not reverse up to a new high without 1st touching the average. But, the odds are that there will be a new all-time high within a month or two because the bull trend is so strong on the monthly chart.
Overnight Emini Globex trading
The Emini is down 7 points in the Globex market. Every big selloff for the past year has had bad follow-through over the next few days. This is likely here as well. As a result, the odds are against today being another big bear day. More likely, the market will be confused for a few days. Consequently, the odds favor a trading range, which means legs up and down for day traders. If there is a huge reversal up lasting 2 or more days, the odds will shift back to favoring a new high before a test of the 20 week EMA.
Friday’s setups
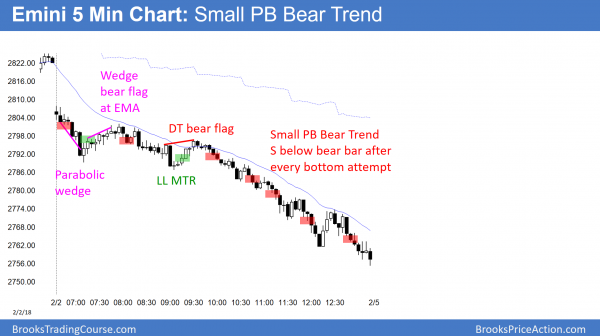
Here are several reasonable stop entry setups from Friday. I sometimes also show limit order entries and entries on the close of bars.
EURUSD 300 pip reversal staring within a week
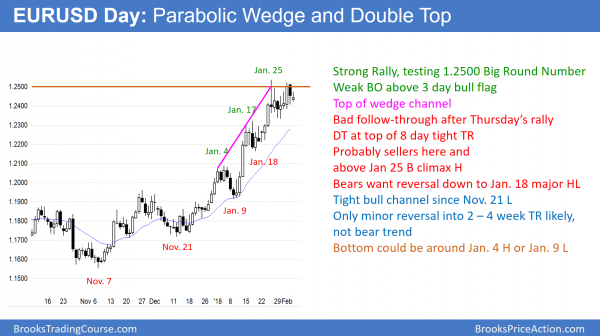
The EURUSD daily Forex chart has been in a tight trading range for 8 days. Since it is at the resistance of the 1.2500 Big Round Number and it is in a parabolic wedge top, the odds favor a pullback for a few weeks. There is now an 8 day double top.
While the EURUSD daily Forex top has continued to break above resistance for a year, the odds are that it will pull back over the next few weeks. The rally is staring to collect many bars with tails on top, and it is in a parabolic wedge channel. These are signs that there are not enough bulls here. Consequently, the chart will probably have to trade lower to find eager buyers. If there is a reversal over the next few days, it will probably have at least 2 legs down and last 10 or more bars. That is what typically happens if there is a reversal from a buy climax.
The bulls want any pullback to be brief and shallow. The want another leg up to start this week because they want the strong 3 month bull trend to continue. Yet, it is more likely that the trend will convert into a trading range that will probably last at least another 2 weeks. The bulls need consecutive strong bull bars breaking above the high of 2 weeks ago before traders will conclude that the bull trend is resuming without a pullback. More likely, there will be sellers at a new high and the breakout will reverse after only a few days.
Overnight EURUSD Forex trading
The EURUSD 5 minute Forex chart is at the top of an 8 day trading range. It has rallied for 4 days but the rally has had deep pullbacks. Therefore, it is more likely a bull leg in the range instead of a resumption of the bull trend.
Since is has been in a 40 pip range overnight, day traders are scalping. They will continue to do so until there is a strong breakout up or down. Furthermore, because of the pattern on the daily chart, if there is a strong bull breakout, day traders will look for a reversal down.
Summary of today’s S&P Emini futures price action and what to expect tomorrow
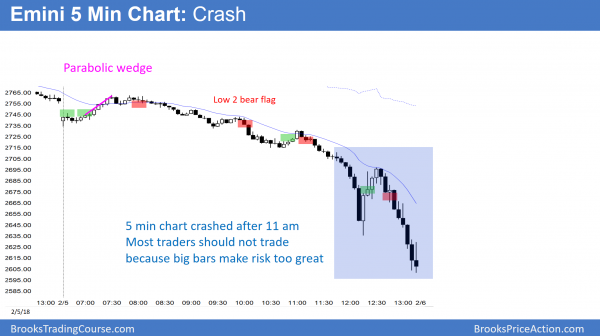
After a strong early rally, the Emini crashed below January’s low and reversed up strongly. It sold off again into the close.
The streak without a 5% correction ended today with the crash on the 5 minute chart. Furthermore, today reached the most important goal of the 20 week EMA. Finally, the Emini fell below last month’s low, which ended the 16 bar bull micro channel on the monthly chart. Therefore, the bears have achieved all of the objectives that I have been describing.
This was a crash on the 5 minute chart, and it might be the end of the selling. The bulls will probably need a micro double bottom this week, or a double bottom over the next month, to confirm any reversal up. If they get it, the Emini could rally back to the all-time high within a few weeks or months.
These 2 big bear days turned the daily chart into a bear trend. The weekly chart might be in a bull flag or it might enter a trading range. Finally, the monthly chart will probably form a bull flag over the next 1 – 3 months.
Because the selloff has been severe, the Emini might have to enter a trading range for a month or two before getting back to the all-time high. The correction might continue to the August 25 low since that was the start of the tight bull channel on the daily chart. It is more likely that this selloff will hold above that low. Less likely, this will be the start of a bear trend on the weekly and monthly charts. The odds are that it will be a buying opportunity that will lead to a new high within several months, but traders should wait for some kind of a double bottom before buying.
See the weekly update for a discussion of the price action on the weekly candlestick chart and for what to expect going into next week.
Traders can see the end of the day bar-by-bar price action report by signing up for free at BrooksPriceAction.com. I talk about the detailed S&P Emini futures price action real-time throughout the day in the BrooksPriceAction.com trading room. We offer a 2 day free trial.
When I mention time, it is USA Pacific Standard Time (the Emini day session opens at 6:30 am PST, and closes at 1:15 pm PST). You can read background information on the intraday market reports on the Intraday Market Update page.


Hi Al,
Any thoughts on the VIX?
Thank you,
Tim
I h ave been talking about the VIX and the VXX ETS for several weeks, and repeatedly made the point that it was rising while the stock market was making a new high. I said that it might be warning traders of a big move down.
The VIX is greatly overdone and dangerous to trade at this point. For example, as I am typing, the XIV ETF is trading at 15, down 86% since the session ended 5 hours ago. This is like trading Bitcoin. Too dangerous, and that makes it gambling and not trading. It is too late to sell and too early to buy. The VIX is based on SPY put premium, which is now greatly inflated. It will quickly shrink as the bear breakout in the stock market transitions into a bear channel or trading range.
Because the range of all financial markets over coming days will get much smaller, the VIX and the VXX will quickly reverse down and the XIV will probably soon rally. Since the daily chart of the S&P has a Big Up, Big Down pattern, there is Big Confusion. This means that all markets will probably go sideways for at least a month. The S&P will probably be sideways to down.
Thank you for that very helpful answer. As an example, last night the April 2000 ES puts were up to $70! Good hard lesson for me.
Good morning Al,
I noted that Nikey 225, Dax and Euro stoxx 50 fell a little lower than beginning of their January swings. Can we assume that SPY or ES will also do the same? or we can’t make such an assumption?
I will write about this in my end of the day comment. The Emini should get down to the December close because the odds are high that it has to fall below the 20 week EMA, which is around that level.