Emini double top after Cohen and Manafort news
I will update again at the end of the day.
Pre-Open market analysis
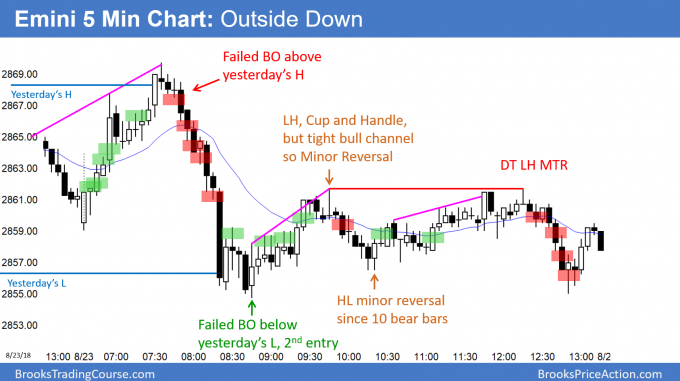
Yesterday rallied, but reversed down strongly, forming an outside down day. It is therefore a sell signal bar on the daily chart. However, it was a doji bar and the 3rd small day in a bull trend. This is a low probability sell signal. Furthermore, the bulls hope that yesterday formed a double bottom bull flag with Tuesday’s low on the 60 minute chart. That chart is now in breakout mode.
The market is always looking for an excuse to do what it wanted to do anyway. If the Emini sells off over the next several weeks, the news will say that Trump’s problem with Cohen and Manafort or the new China tariffs was the cause. Since the markets already all of this, the news was already factored into the current price. However, the market can use anything as an excuse, and this qualifies.
Today is Friday and therefore weekly support and resistance can be important. The bears want the week to close on its low. It would therefore be a sell signal bar on the weekly chart for a double top with the January high. Since the bull channel from the April low is tight, this would be a weak sell setup. But, it would slightly increase the odds of a reversal down next week.
Overnight Emini Globex trading
The Emini is up 5 points in the Globex market. It therefore might open above yesterday’s trading range. The bulls want a measured move up and then a relentless rally to a new all-time high today. Since big trend days come only about once a week, a trading range day is always more likely. This is especially true after 3 sideways days.
Yesterday’s reversal down was strong and a surprise. If the bulls fail to break strongly above the 60 minute EMA, the bears will try to break below yesterday’s low and create trend resumption down. Traders will swing trade their shorts if the bears get several consecutive big bear bars breaking below yesterday’s low.
The daily chart has 3 dojis and the weekly chart so far this week is a small doji. This is a neutral market and the odds favor another trading range day. However, the all-time high magnet above and the wedge top at the January high increase the chance of a big trend up or down.
Yesterday’s setups
Here are several reasonable stop entry setups from yesterday. I sometimes also show limit order entries and entries on the close of bars. My goal with these charts is to present an Always In perspective. If a trader was trying to be Always In or nearly Always In a position all day, and he was not in a position at the moment, these entries would be logical times for him to enter.
EURUSD Forex High 1 bull flag but buy climax
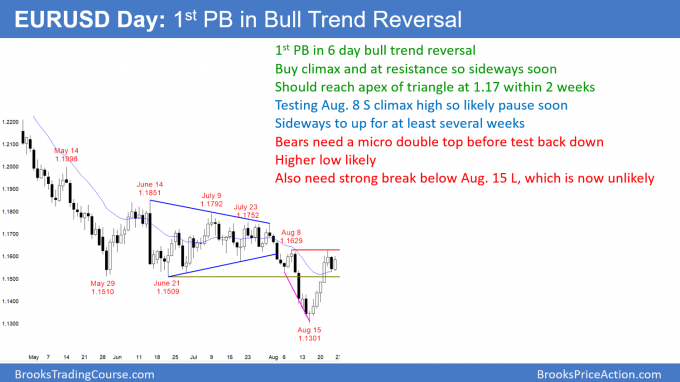
The EURUSD daily chart sold off yesterday to below Wednesday’s low. As was likely after 5 strong bull days, the bulls quickly bought the pullback. Yesterday is now a High 1 bull flag buy signal bar.
I said earlier this week that the bulls will buy at the prior day’s low. The 6 day reversal up was so strong that the bulls were buying every small pullback. They therefore were likely to buy a pullback that fell below the prior day’s low. Today so far reversed most of yesterday’s selloff. Now, yesterday and today are forming a High 1 bull flag. Since the rally is so strong that it is unsustainable, it is a buy climax. Therefore, it will soon convert into a trading range. Yesterday could be the start of that range.
When there is an exceptionally strong rally, the odds favor at least one more small leg up. That can be as brief as a single bar. Whether that leg lasts 1 day or 1 week, the odds favor higher prices.
After that leg up, the daily chart will probably enter a trading range for 1 – 2 weeks. Remember, it is back in a 3 month trading range. Traders thought this 1.17 area was a fair price. They will probably think the same thing again and trade around it for at least a couple of weeks.
How likely is a resumption of the bear trend?
If the breakout above the 2 day bull flag reverses after 1 day, can the bears resume the bear trend? That is unlikely. However, they could get a sharp selloff that retraces much of the rally. But, the odds would favor a higher low. The minimum goal would be a 2nd leg up that at least a test back up to the high of this buy climax. Therefore, the downside risk over the next few weeks is small.
Overnight EURUSD Forex trading
The EURUSD 5 minute Forex chart rallied 70 pips overnight after yesterday’s small break below Wednesday’s low. Yesterday and today are sideways days after a strong rally. This is a 2 day bull flag. The downside risk over the next few days is small. But, since the 6 day rally was climactic, the EURUSD 5 minute chart might continue sideways for several days.
The odds favor higher prices, even if there is a selloff that retraces half of the 2 week rally. Therefore, the bulls will buy pullbacks. The minimum target over the next week is 1.17, which is the apex of the 2 month triangle and the middle of the 3 month trading. The odds are that the rally will continue up to the 1.1752 top of the triangle within a few weeks.
Because the daily chart is now in a bull trend, it will be easier for day traders to make money buying rather than selling. The shorts for at least the next couple of days will only be scalps.
Because the overnight rally on the 5 minute chart was a parabolic wedge and it totally reversed Wednesday’s selloff, today will probably be sideways for the rest of the day.
Summary of today’s S&P Emini futures price action and what to expect tomorrow
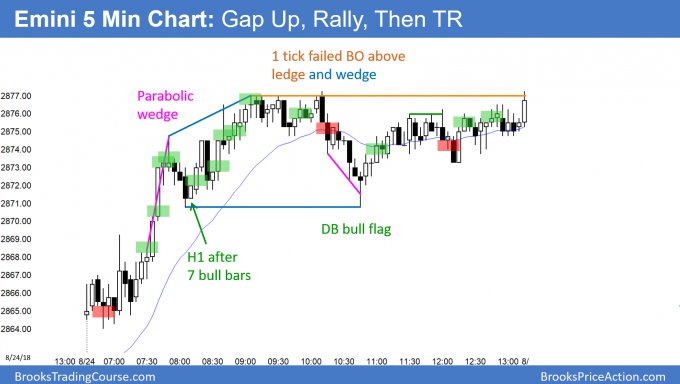
Here are several reasonable stop entry setups for today. I sometimes also show limit order entries and entries on the close of bars. My goal with these charts is to present an Always In perspective. If a trader was trying to be Always In or nearly Always In a position all day, and he was not in a position at the moment, these entries would be logical times for him to enter.
While the cash index went above Wednesday’s all-time high, the Emini’s rally stopped about 7 points below its January all-time high. It remained in a trading range for the rest of the day. The bulls will probably get a new all-time high within a few weeks, and maybe next week.
With the day and week closing on the high, the bulls might get a gap up on both the daily and weekly charts. Furthermore, a big gap up could be a gap to a new high. If the bulls then got a bull trend on Monday, the Emini would then probably work up to the measured move targets around 3100 and 3200 over the next few months.
The bears need several consecutive big bear days before traders will believe that a double top reversal is underway. The odds favor the bulls.
See the weekly update for a discussion of the price action on the weekly candlestick chart and for what to expect going into next week.
Traders can see the end of the day bar-by-bar price action report by signing up for free at BrooksPriceAction.com. I talk about the detailed S&P Emini futures price action real-time throughout the day in the BrooksPriceAction.com trading room. We offer a 2 day free trial.
When I mention time, it is USA Pacific Standard Time (the Emini day session opens at 6:30 am PST, and closes at 1:15 pm PST). You can read background information on the intraday market reports on the Intraday Market Update page.


