Emini double bottom bull flag just below resistance
I will update again at the end of the day.
Pre-Open market analysis
Last week was the 2nd consecutive doji bar on the weekly chart. It is a buy signal bar for this week, but a bear doji bar is a low probability setup for a swing up.
The weekly chart triggered a sell signal last week, yet the setup was weak. The daily chart had a bear inside bar on Friday. Also, Thursday was a big bear day. Therefore, Friday is a sell signal on the daily chart. But, the daily chart lacks strong legs up or down. Hence, a buy or sell signal is likely to lead to a 3 – 5 day move and not a trend.
The daily chart last week reversed up twice from above the May 22 high. There is therefore a gap between those two lows and the May breakout point. The bulls want a 160 or 190 point measured move up. But, unless they break above the March high in the next few weeks, the bears will probably get a swing down for several weeks. Furthermore, the daily chart is in a trading range, which disappoints bulls and bears. The odds are that the gap will close this week and disappoint the bulls.
June 26 to July 5 is up about 70% of the time. There is therefore a slight seasonal bias starting this week. However, the most important factor is the March high. The bulls need a strong breakout above it. Else, the 3 month rally is just a bull leg in a 5 month trading range.
Since the Emini is near major resistance, a big trend up or down can come at any time. However, most days have spent a lot of time in trading ranges, so that is likely again today.
Overnight Emini Globex trading
The Emini is down 14 points in the Globex market. This is not how a reversal up from a gap usually behaves. It therefore increases the odds that the gap above the May 22 high will close this week. If so, it would be another sign that the rally from the April low is just a bull leg in the 5 month trading range.
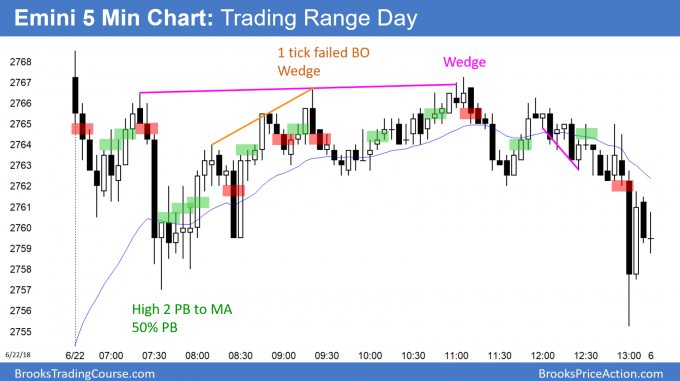
Friday was mostly sideways, as were most days over the past month. Also, the Globex session was mostly sideways. This increases the chance that today will have a lot of trading range trading as well.
Friday’s setups
Here are several reasonable stop entry setups from Friday. I sometimes also show limit order entries and entries on the close of bars.
EURUSD Forex double bottom and weekly buy signal bar
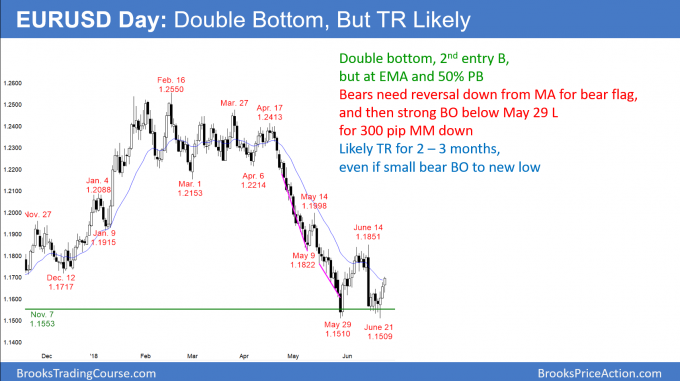
The EURUSD daily Forex chart has rallied for 3 days from a double bottom with the May 29 low. This is also a larger double bottom with the November 7 low. However, it is now at the resistance of the 20 day EMA and a 50% retracement.
The EURUSD daily Forex chart has rallied for 3 days from the support of the May 29 low and the November 7 low. In addition, the weekly chart last week (not shown) was a a bull bar closing on its high. That is a strong buy signal bar.
But, context is always more important than a candlestick pattern. The selloff in April and May was extremely strong. Therefore, the odds are that the daily chart has entered a 2 – 3 month trading range. There is currently only a 30% chance that it is now in an early bull trend.
A trading range has at least 2 legs up and 2 legs down, and usually more. This rally is the 2nd leg up. Therefore, it will probably be followed by at least a small 2nd leg down. The 3 day rally has retraced about half of the selloff from 2 weeks ago. It is therefore at the resistance of a 50% pullback. Furthermore, it is at the resistance of the 20 day EMA.
When a sell climax evolves into a trading range, there is a magnet at the top of the most recent sell climax. Consequently, the daily chart will probably rally to at least the June 14 high within a couple of months. It might even reach the May 14 lower high. After reaching either of these 2 targets, it would then retrace at least half of the rally. This process will take at least another month or two.
Bear flag, but trading range more likely
I said that the 3 day rally is at resistance. The bears want the rally to stall here and form a bear flag. They then want a break below the double bottom and a 300 pip measured move down.
While they might get that a few months from now, the daily chart is in a trading range. Most trading range breakouts fail. There will probably be more buyers than sellers below the June low. The bears need a couple strong bear bars breaking 100 pips below that low before traders will conclude that the bear trend is ending. The bulls will buy any breakout that is less strong.
Overnight EURUSD Forex trading
The EURUSD 5 minute Forex chart rallied 50 pips over the past hour. However, this is the 3rd leg up on the 60 minute chart and it is therefore a wedge rally. A wedge bull channel typically converts into a trading range. In, addition, the rally is at resistance on the daily chart. So, this rally will probably stall over the next 2 hours and begin to go sideways.
While the odds favor a test of the June 14 high at 1.1851 within a few weeks, the 5 and 60 minute charts will have several 50 – 100 pip selloffs along the way. Since the rally on the 5 minute chart is probably within a bull leg in a trading range on the daily chart, both the bulls and the bears will look to sell rallies and buy pullbacks for 30 – 50 pip day trades.
The rally on the 5 minute chart is starting to form small, overlapping bars with prominent tails. These are early signs of a tight trading range. Day traders will begin to switch to scalping for 10 pips. They will soon look for a sell setup for a 30 – 50 pip pullback today or tomorrow.
Since the daily chart is in a trading range, day traders will be buying low, selling high, and going for small profits. Many will trade small and scale in to increase their probability. They will continue to do this until there is a strong breakout with follow-through up or down on the daily chart. Once that occurs, they will conclude that the trading range on the daily chart has broken out and a new trend has begun.
Summary of today’s S&P Emini futures price action and what to expect tomorrow
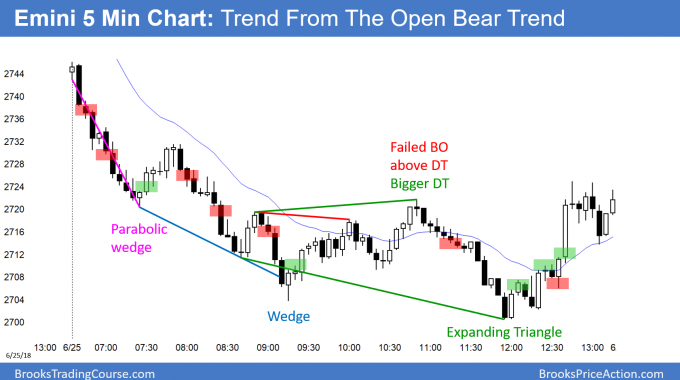
After a big gap down and strong selloff, the Emini went sideways for the rest of the day. There was a late reversal up from an expanding triangle bottom just above the 2700 Big Round Number.
The bears had a strong Trend From The Open Bear Trend. After an expanding triangle bottom, the bulls got a late rally. The big selloff and then the big rally create confusion. This typically results in a trading range. Furthermore, the Emini is back in the May trading range. Therefore the Emini has an increased chance of being sideways for a few days.
See the weekly update for a discussion of the price action on the weekly candlestick chart and for what to expect going into next week.
Traders can see the end of the day bar-by-bar price action report by signing up for free at BrooksPriceAction.com. I talk about the detailed S&P Emini futures price action real-time throughout the day in the BrooksPriceAction.com trading room. We offer a 2 day free trial.
When I mention time, it is USA Pacific Standard Time (the Emini day session opens at 6:30 am PST, and closes at 1:15 pm PST). You can read background information on the intraday market reports on the Intraday Market Update page.


AL,
I’m trying to square some of your commentary with the buy/sell markings on your daily 5-minute chart posted here. For example, today in your commentary you said: “I did not sell below 6” but in the chart above your clearly show a sell “mark” below 6 and it would not only have been profitable for a scalp, but also for a reasonable swing. You argued legitimately that the bar was too far below the average price, that the bars were obviously sell climaxes and risky to take that far down from the opening. So should it have been marked a sell?
So how should I make good trading decisions in the heat of the market without the benefit of what will likely happen when on the one hand you wisely suggest not to take a trade because of the obvious location and risks, but on the other hand mark your daily chart with trade winners based some apparent hindsight observation; not on what your contemporary comments seem to suggest.
Just curious!
Nevertheless, many thanks for your daily insights into the market and often good trades.
Bob
There are many reasons why I cannot take every trade that I show on the chart. For example, if I am talking in the chat room, I usually do not take a trade because I need to focus on a trade when I take it. Also, I sometimes enter early, before a mark on the chart, or I might already in from an earlier entry. If you think about your own day, there are many times when you are not focused on the chart at the moment a signal happens.
My goal with these charts is to present an Always In perspective. If a trader was trying to be Always In or nearly Always In a position all day, and he was not in a position at the moment, these entries would be logical times for him to enter.
Al,
Many thanks for the clarification and especially the notion that the chart markings generally present an Always In perspective. That is very helpful. I’ve given a lot of thought about looking at the day’s trading from an Always In point of view (of course without being Always In) and should probably think about taking positions from that perspective.
Once again you are very insightful and I very much appreciate your prompt replies and excellent ideas when it comes to trading.
Bob
Traders can see the end of the day bar-by-bar price action report by signing up for free at BrooksPriceAction.com – I have a login and went to that site, but could not find the ‘bar by bar’ price action report. Could you please tell me how to navigate to it once I am signed in to Brookpriceaction.com / thx
Hi Ronald,
Once logged in just go to Forum (second link from top of Board Navigation). Then at top of the ‘Trading’ section, you will find ‘Trading Updates from Al Brooks’.
You can either go into sub-forum by clicking the ‘Trading Updates…’ link to find day of interest, or usually can click the right-hand-side ‘Last Post’ link to go straight to latest update.