Emini daily buy signal stronger than weekly sell signal
I will update again at the end of the day.
Pre-Open market analysis
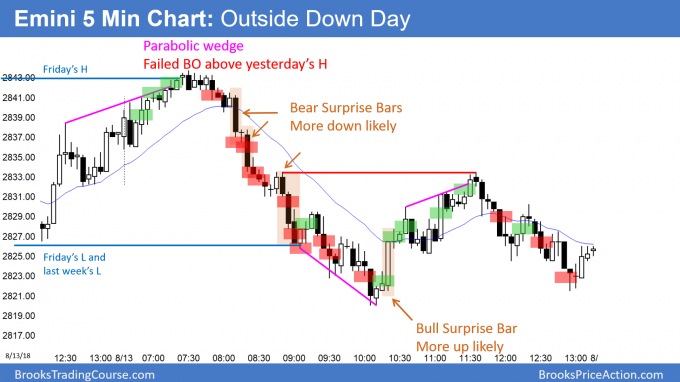
Friday was a weak buy signal bar on the daily chart. There were therefore likely sellers above. Yesterday triggered the buy, but then reversed down. It broke below Friday’s low and formed an outside down day.
Last week was a weak sell signal bar on the weekly chart. By trading below last week’s low, yesterday triggered the sell signal on the weekly chart. The bears want the week to be a big bear bar on the weekly chart. The bulls would like it to close above the open and form a High 1 bull flag for next week.
While yesterday was an outside down bar on the daily chart, it had fairly conspicuous tails above and below. In addition, the daily chart is at the 20 day EMA and a 50% pullback from the rally 2 weeks ago. This signifies confusion and makes more sideways trading likely today. The bulls still want a gap up any day this week. That would create an island bottom and increase the chances that the pullback has ended.
The bears want a test of the August buy climax low. While the odds still favor a new all-time high, this pullback might last 1 – 3 weeks.
Overnight Emini Globex trading
The Emini is up 7 points in the Globex session. The bulls want yesterday to be a double bottom on the 5 minute chart. A measured move up would be above the 60 minute EMA.
When there is an outside day, like yesterday, there is an increased chance that today will be an inside way. If so, today will be an ioi bull flag and a buy signal bar on the daily chart. With the Emini likely to open in the middle of yesterday’s range, the odds of an inside day are higher. Furthermore, it is in the middle of the strong 4 day rally of 2 weeks ago. That also increases the chance of an inside day, or at least another sideways day.
While the bears want another big bear day, the 2 days of hesitation at the 20 day EMA and the 50% pullback on the daily chart make that unlikely. The bears and bulls are balanced at support. This reduces the chance of a big trend day today.
Yesterday’s setups
Here are several reasonable stop entry setups from yesterday. I sometimes also show limit order entries and entries on the close of bars. My goal with these charts is to present an Always In perspective. If a trader was trying to be Always In or nearly Always In a position all day, and he was not in a position at the moment, these entries would be logical times for him to enter.
EURUSD Forex Low 1 bear flag after breakout below Final Bear Flag
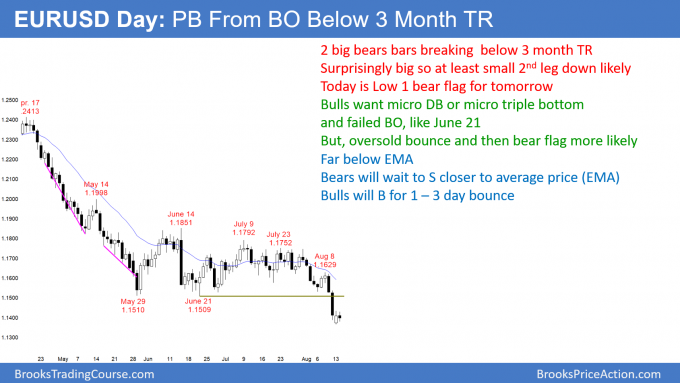
The EURUSD daily Forex chart had a small bull day yesterday after a strong breakout below a trading range. There will probably be at least a small 2nd leg down this week. If today’s low stays above yesterday’s, today will be a Low 1 bear flag sell signal bar.
The EURUSD daily Forex chart broke far enough below the 3 month trading range to make lower prices likely. A trading range late in a bear trend is usually the Final Bear Flag. Therefore, this breakout will probably reverse back up into the range after it runs its course. There is a 50% chance of a measured move down to around 1.12 over the next 2 months.
Yesterday was a bull bar and a pause in the bear breakout. If today’s low stays above yesterday’s low, today will be a Low 1 bear flag. The odds favor at least a small 2nd leg down. But, the price is far below the the EMA. Consequently, many bears will only scalp here. Traders will be ready for the break below today’s low to reverse up within a couple of days. That might form a micro double bottom with yesterday’s low.
Might get breakout test of 1.15
While the bulls want a failed breakout and a reversal up, the best they probably will get is a bigger bear flag. The rally might test the 1.15 bottom of the trading range and the EMA before the bears begin a 2nd leg down.
Since the past 2 days have been sideways, there is an increased chance of more sideways trading today. Furthermore, there will probably be a test the 1.15 within a couple of weeks. Therefore, bulls will buy a reversal up to that level.
Overnight EURUSD Forex trading
The EURUSD 5 minute Forex chart has been in a 50 pip range for 2 days. This is a bear flag on the 60 minute chart. But, the 2 day selloff was extreme and therefore climactic. Consequently, traders know that there is a 40% chance of a 100 pip rally within a week. They therefore will look for a rally that could last a couple of weeks.
Since the bears expect at least 1 – 2 days of follow-through selling after this 2 day pause, the bulls will watch to see if that selling is weak and brief. If they sense that the bears are only scalping, the bulls will look to buy for a 100 reversal up over the next week or two.
The bears know that there is a 60% chance of at least one more day down this week. But, because the daily chart is so far below the EMA, they will be quick to take profits. They want to sell closer to the average price.
With both bulls and bears expecting limited selling and a 100 pip rally soon, day traders will be willing to buy and sell. If reversals are strong, they will swing trade for 30+ pips. But, because the odds are that the sell climax on the daily chart will lead to a trading range for a couple of weeks, most day traders will be scalping.
Summary of today’s S&P Emini futures price action and what to expect tomorrow
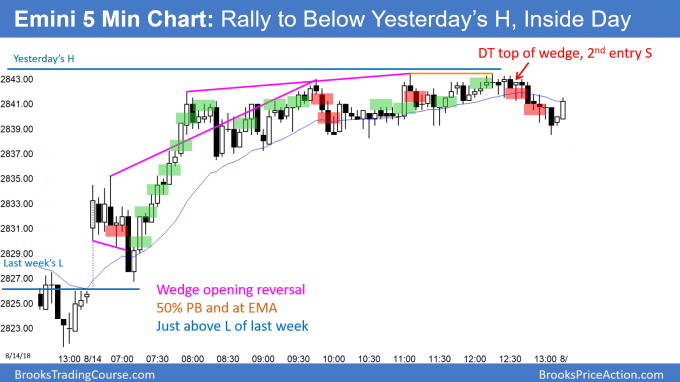
Here are several reasonable stop entry setups for today. I sometimes also show limit order entries and entries on the close of bars. My goal with these charts is to present an Always In perspective. If a trader was trying to be Always In or nearly Always In a position all day, and he was not in a position at the moment, these entries would be logical times for him to enter.
The bulls got a reversal up from last week’s low, but the rally stalled just below yesterday’s high. Today therefore was an inside day after an outside day. It is both a buy and sell signal bar for tomorrow. After 3 sideways days, the Emini is in breakout mode. The odds still favor another week or two sideways to down. However, they also favor a new all-time high within a couple of months. If tomorrow gaps up to form a 3 day island bottom, then the week may go outside up. This would make a new high likely within weeks.
See the weekly update for a discussion of the price action on the weekly candlestick chart and for what to expect going into next week.
Traders can see the end of the day bar-by-bar price action report by signing up for free at BrooksPriceAction.com. I talk about the detailed S&P Emini futures price action real-time throughout the day in the BrooksPriceAction.com trading room. We offer a 2 day free trial.
When I mention time, it is USA Pacific Standard Time (the Emini day session opens at 6:30 am PST, and closes at 1:15 pm PST). You can read background information on the intraday market reports on the Intraday Market Update page.


am i looking at the wrong chart, the daily chart is not at the 20 EMA.
I suspect that we are looking at different things. You should be sure that you are looking at the DAILY and not weekly, and that you are looking at the Emini continuation chart.