Emini correction continuing during Trump’s trade war with China
Updated 6:43 a.m.
The Emini gapped up. Resistance above is at the top of Friday’s sell climax around 2636. That is also near the open of the month and the 60 minute EMA. Support below is at Friday’s close and the EMA. Since Friday ended with a big down move and the Emini is now having a big up move from Friday’s low, there is Big Confusion. An early trading range is likely. The Emini is deciding on whether to test the top or bottom 1st. The odds favor a trading range day.
Since Friday was a big day and the Emini is in the middle of Friday’s range, there is an increased chance of an inside day. While the Emini sold off on the 2nd bar, the follow-through was bad. In addition, there is room to the resistance above. The odds favor an early high either at the current price or slightly high, and then a trading range.
Pre-Open market analysis
The Emini sold off strongly on Friday, but reversed up at the March low. The bears have a double top bear flag on the daily chart and Friday was the entry bar. However, the daily chart is in a 10 bar tight trading range. Until there is a breakout, there is no breakout. Instead, it is more likely that every leg will reverse after a couple of days.
If the bears break strongly below the February low, the Emini will probably fall below to the 20 month EMA to around 2400. A bull breakout above the 2 week range would likely lead to a test of the March high around 2800.
Overnight Emini Globex trading
The Emini is up 13 points in the Globex session. The 1st target for the bulls today is the top of Friday’s sell climax at 2634.25. That is also at the magnet of the 20 bar EMA on the 60 minute chart. The bears should be able to prevent a rally above that area today. Therefore, day traders will look for any rally today to end there.
Friday’s late selloff was in a tight bear channel. Therefore the rally at the end of the day was a minor reversal. This is true even if today gaps up. The bulls will need a test back down to form a major reversal up. However, if today rallies strongly on the open, the test back down could be as brief as a couple of bars.
Because the Emini has been reversing every couple of days, the odds favor a reversal up today. Therefore, the bulls will look for a buy setup after any selloff in the 1st 2 hours today.
A major bottom typically leads to a trading range and not a bull trend. That is therefore what is most likely today. Since the ranges have been big for 2 weeks, a trading range will have legs that are big enough for swing trading.
Friday’s setups
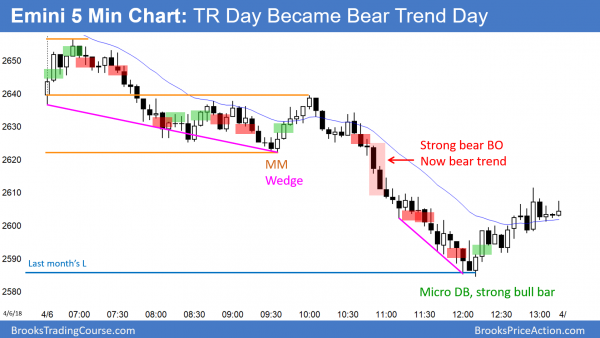
Here are several reasonable stop entry setups from Friday. I sometimes also show limit order entries and entries on the close of bars.
EURUSD Forex market trading strategies
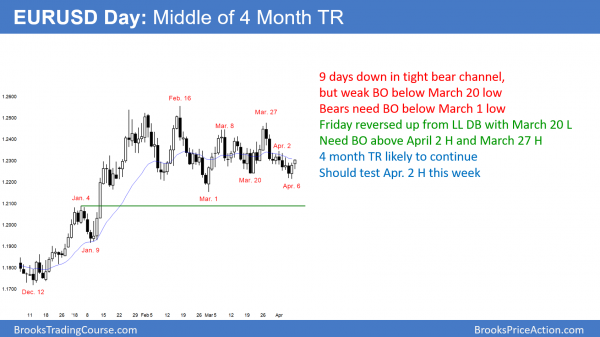
The EURUSD daily Forex chart reversed up on Friday from a lower low double bottom with the March 20 low. The next target is the April 2 high where the bears will try for a small double top.
The EURUSD daily Forex chart has been in a trading range for 4 months. It reversed up on Friday from a failed break below the March 20 low. It should test the April 2 high today or tomorrow. The bears will try for a double top. If the bulls break strongly above, they then will test the March 27 high.
There is no sign that the 4 month range is about to break out. Traders will continue to look for reversals every 3 – 5 days.
Overnight EURUSD Forex trading
The EURUSD 5 minute Forex chart rallied 100 pips from Friday’s low. The momentum up is strong enough to reach the next resistance level of the April 2 lower high. It is only 40 pips up.
The bears will try to create a small double top bear flag there. Since the daily chart is in the middle of a 4 month trading range, the odds favor at least a small reversal at that level. The bulls need to break above it by at least 20 pips. If they succeed, they next will test the March 27 high. Today or tomorrow should rally another 40 pips up to that target. Traders will then watch for either a breakout or a reversal down.
If the bears get a strong reversal down to below Friday’s low, they next will test the March 1 low.
Summary of today’s S&P Emini futures price action and what to expect tomorrow
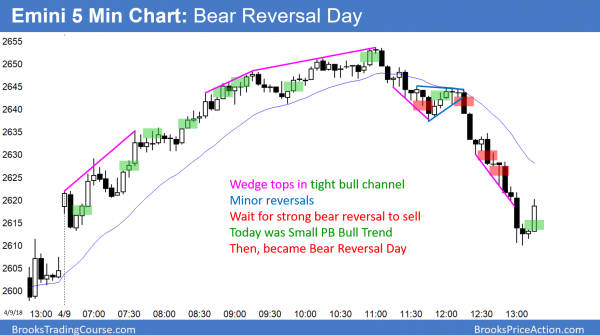
The Emini was in a Small Pullback Bull Trend until late. It then reversed down and formed a bear reversal day.
The bulls had a strong rally yesterday. Yet, the Emini is still in a 10 day trading range. As I explained over the weekend, unless the bulls break strongly above the March 27 high, the odds favor a break below the February low within a few weeks.
See the weekly update for a discussion of the price action on the weekly candlestick chart and for what to expect going into next week.
Traders can see the end of the day bar-by-bar price action report by signing up for free at BrooksPriceAction.com. I talk about the detailed S&P Emini futures price action real-time throughout the day in the BrooksPriceAction.com trading room. We offer a 2 day free trial.
When I mention time, it is USA Pacific Standard Time (the Emini day session opens at 6:30 am PST, and closes at 1:15 pm PST). You can read background information on the intraday market reports on the Intraday Market Update page.


