Emini buy vacuum test of July high and all-time high
I will update again at the end of the day.
Pre-Open market analysis
Yesterday was the 3rd consecutive strong bull trend day. It broke above last week’s high and the July high. However, the 5 minute chart has been in a tight bull channel for 3 days. Tight bull channels rarely last more than 3 days. Therefore, today will probably be a trading range day and a pause in the bull trend.
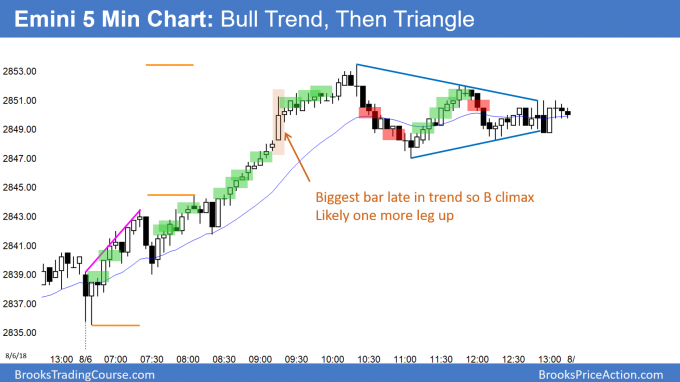
Yesterday ended with a triangle, which was late in a bull trend. That will probably either be the Final Bull Flag before a pullback to the 60 minute EMA, or it will be a triangle top that will lead to a pullback to the 60 minute EMA.
Can today be a 4th strong bull trend day? Of course, but that is less likely than mostly a trading range day.
The 3 day bull channel is a sign of strong bulls. That makes a bear trend unlikely without the Emini 1st going sideways for at least a couple of hours. With the 3 day breakout as strong as it is on the daily chart, the bears will need at least a micro double top before traders think that the bulls might have lost control. Therefore, the downside risk is small for the next couple of days. The 1st reversal will probably only last a day to a day and a half.
Overnight Emini Globex trading
The Emini is up 6 points in the Globex market. It might therefore gap above yesterday’s high. But, the gap would be small. Small gaps typically close in the 1st hour and are not meaningful. Furthermore, after 3 days in a tight bull channel, today will probably be a pause day in the strong bull trend.
However, the odds are that last year’s bull trend is resuming. If so, this rally could be unusually strong. Therefore, even though unlikely, traders should be ready for a surprisingly strong series of bull trend days. If today is another one, day traders will swing trade again, even though a trading range day is more likely.
Yesterday’s setups
Here are several reasonable stop entry setups from yesterday. I sometimes also show limit order entries and entries on the close of bars. My goal with these charts is to present an Always In perspective. If a trader was trying to be Always In or nearly Always In a position all day, and he was not in a position at the moment, these entries would be logical times for him to enter.
EURUSD Forex market trading strategies
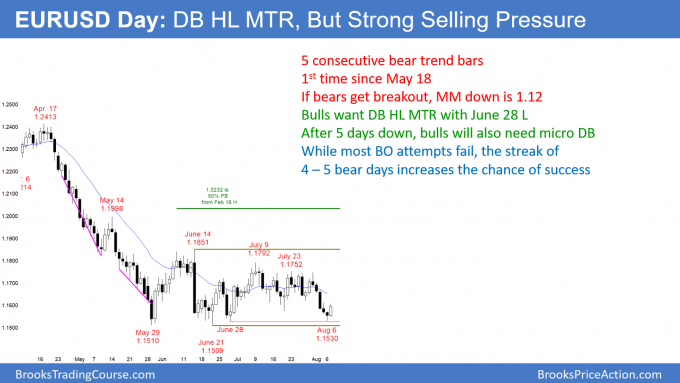
The EURUSD daily Forex chart is reversing up from a double bottom with the June 28 low. Both bottoms are above the June 21 bottom of the bull trend reversal. Therefore, this is a double bottom higher low major trend reversal attempt. However, the 5 consecutive bear days makes a bear breakout slightly more likely.
The EURUSD daily Forex chart yesterday formed its 5th consecutive bear day yesterday. This is the 1st time that the chart has had more than 4 consecutive trend days up or down since the trading range began on May 29. Because this selling pressure is unusual, it increases the chance that it is the start of a bear breakout.
Most breakout attempts fail, even when they are strong, like this one is. However, after 5 bear days, the bulls will probably need at least a micro double bottom over the next few days before they can erase what the bears have accomplished.
The bears will try to stop the bull reversal up from the bottom of the trading range. Typically, they would create a double top bear flag just below the 20 day EMA.
The odds are that the Emini will bounce today and maybe tomorrow. It will then form a small trading range. The range will have a small double top bear flag and a micro double bottom. The direction of the breakout of that small pattern will probably determine what the daily chart will do over the next month.
If the bulls get a strong reversal up, the 3 month trading range will continue. In addition, they will hope for a breakout above the top of the range at 1.1850. However, if the bears get consecutive closes below the June 21 low and 1.15, the chart will probably work down to around 1.12.
Overnight EURUSD Forex trading
The EURUSD 5 minute Forex chart rallied 50 pips in Europe overnight. But, a tight trading range is likely over the next week. Consequently, the rally will probably stall between 1.1600 and 1.1650. The legs in the upcoming tight trading range on the daily chart typically last only a day or two. Therefore, traders will look for reversals after 1 – 2 days up or down. They expect both a double top and a double bottom between 1.15 and 1.1650 over the next week.
If the rally reaches 1.17, the odds of the bear breakout below the 3 month range drop back to where they were last week. The chart would be back to neutral.
Summary of today’s S&P Emini futures price action and what to expect tomorrow
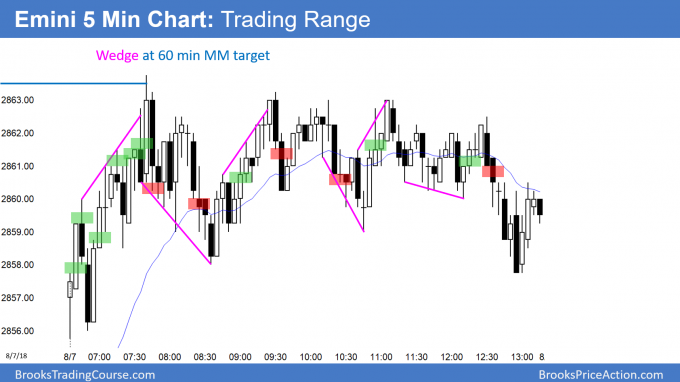
Here are several reasonable stop entry setups for today. I sometimes also show limit order entries and entries on the close of bars. My goal with these charts is to present an Always In perspective. If a trader was trying to be Always In or nearly Always In a position all day, and he was not in a position at the moment, these entries would be logical times for him to enter.
Today was the 4th consecutive bull trend day, but the rally stalled at the 60 minute chart’s measured move target. In addition, the 60 minute chart has a parabolic wedge rally. The Emini will likely pull back tomorrow and maybe Thursday after such a climactic rally.
See the weekly update for a discussion of the price action on the weekly candlestick chart and for what to expect going into next week.
Traders can see the end of the day bar-by-bar price action report by signing up for free at BrooksPriceAction.com. I talk about the detailed S&P Emini futures price action real-time throughout the day in the BrooksPriceAction.com trading room. We offer a 2 day free trial.
When I mention time, it is USA Pacific Standard Time (the Emini day session opens at 6:30 am PST, and closes at 1:15 pm PST). You can read background information on the intraday market reports on the Intraday Market Update page.


‘the rally stalled at the 60 minute chart’s measured move target. ; Al, it would be very instructive if you could indicate the basis for this specific measured moved. thx
On the 60 minute chart at 9:30 a.m. PST on August 3, there is a breakout test of the high from 5 bars earlier, and a reversal up. That is the measuring gap.
These intraday updates are super helpful. They are a great way to learn your system from current markets. Can’t thank you enough for posting them.