Emini buy signal and test of 2700 big round number
I will update again at the end of the day
Pre-Open market analysis
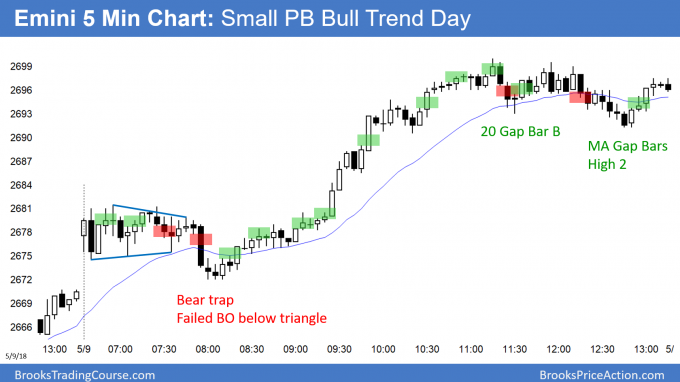
The Emini triggered buy signals on the daily and weekly charts yesterday. It was in a small pullback bull trend, and it tested the 2700 Big Round Number. The rally will probably test the April 18 lower high of 2718 within a few days.
Because yesterday was a strong bull trend day, there is a 60% chance that it will be a successful breakout above the 3 week triangle. If the bulls can get several bull days over the next week, the rally will probably continue up to a new high within a couple of months.
The bears need a strong reversal down today or tomorrow to increase their chances of a reversal down to the April low. Since the Emini is still in a trading range and making lower highs, the bears have a 40% chance of success. Each additional bull day lowers the chances for the bears.
Overnight Emini Globex trading
The Emini is up 7 points in the Globex market. Since the odds are that the 4 month correction has ended, there is an increased chance of bull trend days over the next few weeks. Most bull trend days have early lows. Therefore, traders will look for a reversal up from any early selloff.
Alternatively, there will be either a swing down for the 1st half of the day and a reversal up, or a trading range and then a late bull breakout. The odds favor bull days on the daily chart. Therefore, the 5 minute chart will tend to close near its high or at least above the open every day. As long as the odds continue to favor a bull trend on the daily chart, traders will be looking for long swing trading opportunities.
Every bull trend has strong bear trend days. Yet, the selling usually lasts only a day or two. Day traders will be willing to swing trade their shorts during the selloffs. However, they will look for reversals back up within a day or two.
If the Emini gets 2 – 3 consecutive big bear days, the daily chart will be back to neutral. Traders will then expect the 4 month trading range to continue. The bears will need a very strong leg down before traders again think that the bears are in control.
Yesterday’s setups
Here are several reasonable stop entry setups from yesterday. I sometimes also show limit order entries and entries on the close of bars.
EURUSD Forex market forming minor parabolic wedge bottom
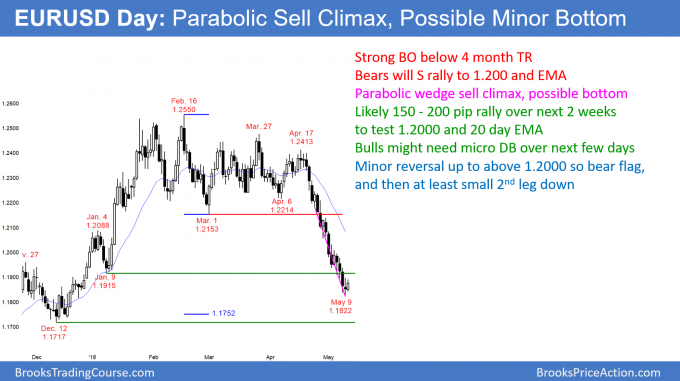
The EURUSD daily Forex chart has fallen in a parabolic wedge sell climax. It therefore will likely bounce to 1.2000 within a couple of weeks and form a bear flag.
The EURUSD daily Forex chart has fallen in a tight bear channel for 4 weeks. Today is the 4th bull bar in the sell climax. Since this is a parabolic wedge, the odds are that the selling will temporarily end and there will be a minor rally to resistance. The result will likely be a test above 1.2000 and to the 20 day EMA over the next 2 weeks.
Since the 1st reversal up from a strong bear trend only has a 20% chance of growing into a bull trend, the rally will be a minor reversal. That means that it will probably be a bear flag. However, it could also be a bull leg in what could become a trading range for a month or two. In either case, there is an 80% chance of at least a test back down after the 1st rally. The bears will sell again and the bulls will sell out of there longs at resistance around 1.200.
Overnight EURUSD Forex trading
The EURUSD 5 minute Forex chart has been in an 80 pip trading range for the past 24 hours. Because the sell climax on the daily chart is now extreme, day traders know that traders will buy below prior lows. Furthermore, the odds favor a test of 1.2000.
When a sell climax is extreme, the bear rally can be quick. Consequently, day traders will be willing to hold some of their long traders for 30 – 50 pips if there is a strong bull breakout.
Since the rally will be a bear flag on the daily chart, the bears will sell above prior highs on the 5 minute chart and on reversals down. However, they will now mostly scalp. They know that the downside is likely limited until after a relief rally to around 1.2000. Once the EURUSD reaches resistance, they will again look for swing trades, expecting at least a test back down to the bear trend low.
Summary of today’s S&P Emini futures price action and what to expect tomorrow
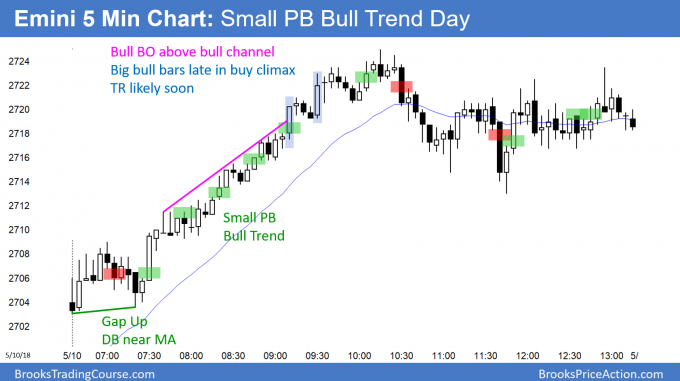
The Emini was in a small pullback bull trend today, but transitioned into a trading range. Since it broke above the April high, it triggered a monthly buy signal.
The Emini was in a small pullback bull trend for the 1st half of the day. By rallying above the April high, the Emini triggered a buy signal on the monthly chart. Yet, April was a doji bar on the monthly chart and therefore a weak buy signal bar. Consequently, the Emini might go sideways more before making a new all-time high. However, the odds favor the bulls. Therefore, the bulls will buy any 1 – 2 day pullback.
The bears want a double top on the daily chart with the April 18 lower high. The momentum and the monthly chart favor the bulls. Unless the bears can create 3 consecutive bear bars on the daily chart, the odds favor a rally up to a new high over the next 2 – 3 months.
See the weekly update for a discussion of the price action on the weekly candlestick chart and for what to expect going into next week.
Traders can see the end of the day bar-by-bar price action report by signing up for free at BrooksPriceAction.com. I talk about the detailed S&P Emini futures price action real-time throughout the day in the BrooksPriceAction.com trading room. We offer a 2 day free trial.
When I mention time, it is USA Pacific Standard Time (the Emini day session opens at 6:30 am PST, and closes at 1:15 pm PST). You can read background information on the intraday market reports on the Intraday Market Update page.


