Emini buy signal on weekly chart for test of 2800
I will update again at the end of the day
Pre-Open market analysis
By breaking above last week’s high yesterday, the bulls triggered a weekly buy signal. But, yesterday was not a big bull trend day. Therefore this week is not yet a strong entry bar on the weekly chart. The bears will try to make the breakout fail today or tomorrow. They want the week to be a bear trend bar on the weekly chart. That would increase the odds of sideways to down trading next week.
The odds still favor the bulls on the daily and weekly charts. The rally should continue up to test of the March high, just above 2800. If there is a strong breakout above that, the rally will likely continue to a new all-time high and a test of 3,000.
A reversal down from around 2,800 would be a double top lower high major trend reversal on the daily chart. It would therefore have a 40% chance of leading to a bear trend on the daily chart.
Since most days over the past month have been primarily trading range days, the odds favor another mostly sideways day again today.
Overnight Emini Globex trading
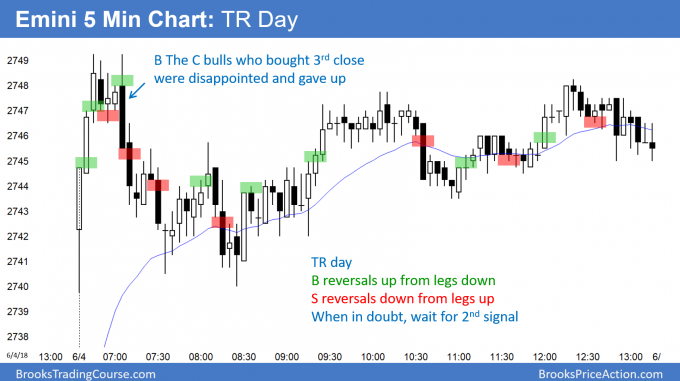
After yesterday’s tight trading range, the Emini is up only 1 point in the Globex session. It is therefore continuing yesterday’s quiet trading. That means that it is still in Breakout Mode.
Since the trading range is in a 5 day rally, it is a bull flag. Therefore, there is a slightly higher probability of a bull breakout and trend resumption up than a bear breakout and trend reversal down.
A Breakout Mode pattern can last several days before there is a breakout. That means that day traders will continue to look for reversals and scalp.
Furthermore, the 1st breakout has a 50% chance of reversing. Day traders will continue to scalp until there is a clear breakout. They will then switch to trend trading.
Yesterday’s setups
Here are several reasonable stop entry setups from yesterday. I sometimes also show limit order entries and entries on the close of bars.
EURUSD Forex market has micro double top after sell climax
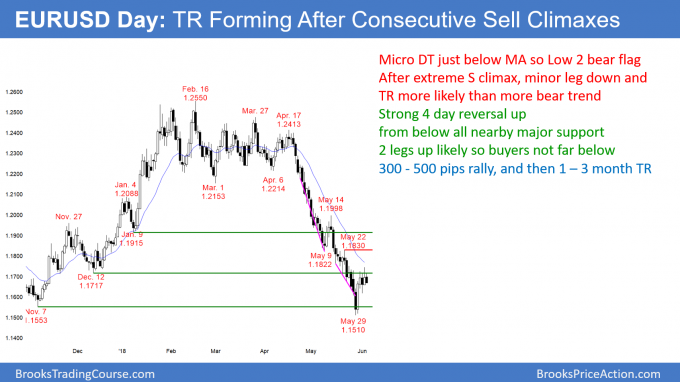
The EURUSD daily Forex chart formed a 3 day micro double top just below the 20 day EMA. Since this came after an extreme sell climax, the odds are that there will be buyers not far below and then a 2nd leg sideways to up.
The EURUSD daily Forex chart collapsed in consecutive parabolic wedge sell climaxes to just below weekly support last week. It then quickly rallied 200 pips. The odds are that it has begun to evolve into a trading range. Therefore, the overnight Low 2 bear flag is more likely to lead to a minor leg down. The bulls will buy the selloff, even if it falls below last week’s low.
A sell climax usually leads to at least 2 legs up. The 4 day rally is either the 1st leg up or the start of the 1st leg up. There is less than a 40% chance that this bear flag will fall for a 200 pip measured move down from below last week’s low. However, if today closes near its low, the bears will sell below today’s low for a about a 50 pip scalp. They know that there will be buyers not far below, like around a 50% pullback from the 4 day rally.
Overnight EURUSD Forex trading
The EURUSD 5 minute Forex chart sold off 50 pips over night and 80 pips from yesterday’s high. Since a trading range is likely, day traders will look to trade reversals for 10 – 30 pip scalps.
If today closes near its low, tomorrow will probably fall at least 20 pips below today’s low. But, the bulls will look for a reversal up from below today’s low. They expect at least a 50% retracement of the 4 day rally.
The fight today is over the close on the daily chart. The bears want the day to close near its low so that today will be a stronger sell signal bar on the daily chart. That would increase the chance of a bigger move down tomorrow.
The bulls want today to close above its open, which is only about 25 pips above the current price. If so, today will be a weak sell signal bar on the daily chart. The bulls tomorrow would be more willing to buy just below today’s low and scale in lower, instead of waiting for a 50% retracement before buying.
Trading range more likely than another leg down
Since the daily chart has been in a strong bear trend, there is always a 40% chance that there will be another leg down far below last week’s low before the trading range begins. Consequently, day traders will swing trade shorts if there is a strong bear trend on the 5 minute chart today.
A new leg down does not have to be another collapse. In fact, that is unlikely. Therefore there is only a 20% chance of a strong bear or bull trend today. It is more likely that today will be a 3rd consecutive trading range day. This is because the daily chart is evolving from a bear trend into a trading range.
Summary of today’s S&P Emini futures price action and what to expect tomorrow
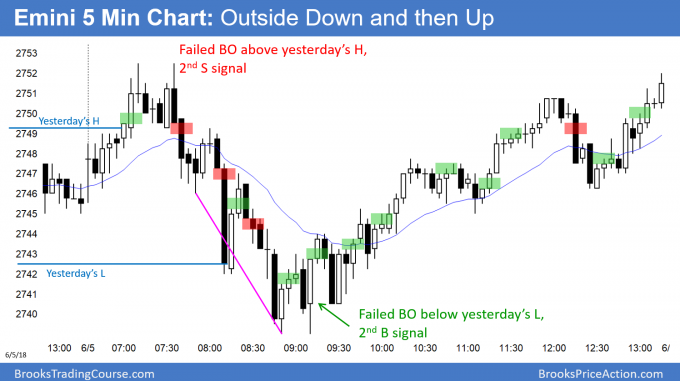
The Emini sold off from above yesterday’s high and broke below yesterday’s low. This was an outside down day. But, the bears failed to close the gap above last week’s high. The bulls got a reversal back above yesterday’s high so the day was also an upside up bull reversal day.
By trading above yesterday’s high and then below its low, today formed an outside down day. However, there were buyers below yesterday’s low and today reversed back up to above yesterday’s high. This was a bull trend reversal day. The bears failed to close the gap above last week’s high.
Most days over the past month have been trading range days, and there is no sign that this is about to end. The odds favor a continued weak rally up to the March high above 2800. However, the rally might accelerate up at any time.
See the weekly update for a discussion of the price action on the weekly candlestick chart and for what to expect going into next week.
Traders can see the end of the day bar-by-bar price action report by signing up for free at BrooksPriceAction.com. I talk about the detailed S&P Emini futures price action real-time throughout the day in the BrooksPriceAction.com trading room. We offer a 2 day free trial.
When I mention time, it is USA Pacific Standard Time (the Emini day session opens at 6:30 am PST, and closes at 1:15 pm PST). You can read background information on the intraday market reports on the Intraday Market Update page.


Hi Al, I want to ask you a question about getting out below bar number 23 on the chart dated 6/5/2018 from a bull’s perspective. For the bears it’s a DT bear flag and a possible measuring gap from the day’s high. But is it enough for the bulls to consider getting out of the trade, who see it as DB fail wedge reversal with good size bull bar around yesterday’s low and also after a good entry bar for them?
In general, until the market is clearly Always In Long, it is better for the bulls to scalp and to get out below a bear bar just below the EMA that closes on its low. This is because the bears who exited above the strong bull bar know that the market is still Always In Short. They will sell below that bear bar for another leg down. They know that the bar tells them that the bulls are giving up and that therefore the bears will overwhelm the bulls below the bar.
Thank you Al.