Emini buy climax creating great put buying opportunity
Updated 6:50 a.m.
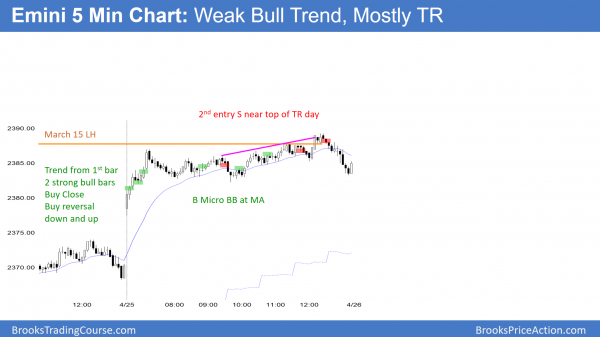
The Emini gapped up and began with bull trend bars. This is therefore a trend from the open bull trend. Consequently, the bears therefore will probably need either a 2nd entry sell signal or a parabolic wedge before there is a reversal down. There is no sign of a top yet. Hence, the bulls will probably buy the 1st reversal down. If the bears get a parabolic wedge top, they could then get a swing down.
Will the 1st bar remain the low of the day? Since there was follow-through buying, the bulls have a 50% chance of already having the low of the day. Yet, because the March 15 high is just a few points above and it is strong resistance, the odds are that this rally will stall soon. However, if the bulls break strongly above that high, today could be a big bull trend day.
At the moment, the Emini is Always In Long. Yet, it is near major resistance. Therefore, the odds are still against a strong bull trend day. Unless the bears create a major reversal, and there is no evidence of that yet, the odds are against a big bear day. Therefore, despite this strongly bullish open, the odds favor a trading range soon.
Pre-Open market analysis
As I have been saying for the past month, the Emini will probably test the March 15 high before falling to below the 20 week exponential moving average. That target is around 2300. Because the Emini never tested the close of last year, the selloff will probably reach it as well.
Consequently, the math is excellent for put buyers. The odds are 70% that the Emini will fall at least to 2300 within the next month before going much above the all-time high. This is an unusual instance when there is a high probability and a strong risk reward ratio. Yet, because few traders see the trade, this is a time when a nearly perfect trade can exist.
Weekly buy climax
The Emini is fascinating at the moment. The daily, weekly, and monthly charts are in strong bull trends. Yesterday’s gap up was therefore a breakout above a 2 month bull flag on the daily chart. This would normally be very bullish and favor much higher prices. Yet, there is an unusual buy climax on the weekly chart that overrides this bullishness.
Can the Emini continue up for a couple more months. Well, during the 8 years of the bull trend, the Emini has never been above its weekly moving average for more than 27 weeks. It has now been above it for 24 weeks. Furthermore, when it has been above the average for 20 or more weeks, it began to turn down by the 24th week, which is this week. Therefore the odds are that this week or next week will be the top for the next month or two.
Island top?
Whenever there is a gap up late in a bull trend, especially at a prior high, traders have to be aware of a possible double top. Furthermore, when the gap is big, as yesterday’s was, the market is emotional. Consequently, there is an increased potential for a big move. Yet, traders always have to be respectful of institutions who believe the exact opposite of what seems so obvious.
As a result, there is an increased potential of a strong reversal down. That can come from an endless pullback from the rally, a big bear bar, like on March 31, or a gap down. If there is a gap down over the next week, it would create an island top. If the gap is big and the day is a big bear trend day, the odds would favor at least some follow-through selling.
Because of the buy climax on the weekly chart, there is at least a 60% chance of some kind of reversal down over then next few weeks, In addition, that reversal down will probably lead to at least a 20 point break below the weekly moving average. That average is currently around 2312.
Overnight Emini Globex trading
The Emini is up 10 points in the Globex market. It therefore will probably gap up again today. Consequently, it is getting vacuumed up quickly to the March 15 lower high of 2,387.75.
While the momentum up is strong, the Emini will probably fail on its 1st attempt to break above that major lower high. Since the open will be within 10 points of the target, there is an increased chance of a lot of trading range trading again today.
If the Emini breaks strongly above that high, it will probably quickly rally to above 2,400. Yet, the buy climax on the weekly chart will probably lead to a reversal down within a few weeks.
EURUSD Forex market trading strategies
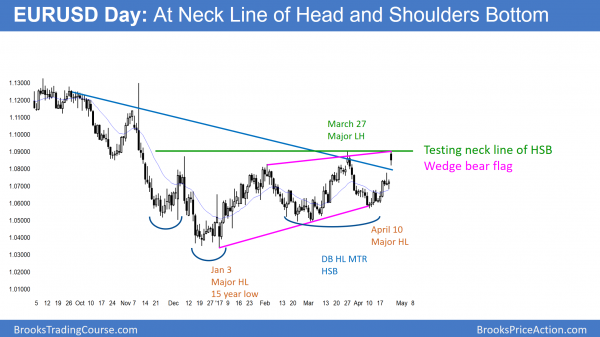
The daily EURUSD Forex market is testing the top of the 6 month trading range. If the bulls get a strong breakout, the next target is the November high.
Yesterday’s big gap up increased the chances of a successful break above the 6 month head and shoulders bottom. Since the momentum up is strong, the odds favor at least a strong break above the range.
If the bulls succeed, the next resistance if the November sell climax high because that is the next major lower high. Yet, most breakout attempts fail. Therefore, the odds are that this one will fail as well, even if it continues for another 50 – 100 pips.
2 year trading range intact
If the EURUSD rallies another 50 pips above the March high and then reverses, the bears would see the 2107 rally as a wedge bear flag on the weekly charts. Therefore, the bulls need much more to convince traders that the 2 year trading range is about to end. Consequently, they need to break strongly above its top, which is the November 2015 high of 1.1712.
Breaking above the 6 month high is therefore only one small step in the process. As a result, traders will assume that the 2 year trading range will continue indefinitely. Since the monthly chart is still below its moving average, the odds still slightly favor a bear breakout of the 2 year range.
Overnight EURUSD Forex trading
The 240 minute chart has had 3 pushes up over the past 12 days. Since the current 3rd push has been strong, the bears will probably need at least a micro double top before they can create a reversal down. Yesterday’s sell off and then the 30 point rally of the past 2 hours met that minimum.
Since the 12 day bull channel is tight, the odds are that the 1st reversal down would be minor. Therefore, the best the bears can probably get over the next week is a 50 – 100 pip pullback. Hence, they want the strong rally to evolve into a trading range. If they succeed, they then would try to create a major trend reversal. The bulls know that the odds are that the 1st reversal will fail. They therefore correctly believe that the rally will continue for at least another 50 – 100 pips over the next week or so.
The odds are that the bulls will get their break above the November high. Yet, because most breakouts fail, the new high will probably reverse down and be the 3rd push up in a 6 month wedge rally.
Consequently, this strong 3 week rally will be just another strong leg in the 6 month trading range. Hence, it will likely be similar to the strong selloff in early April. The trading range will therefore probably continue indefinitely.
Summary of today’s S&P Emini futures price action and what to expect tomorrow
The Emini gapped up and rallied above the March 15 major lower high. Yet the rally was weak and will probably be a bull leg in a trading range.
While the bulls got a gap up and a rally above the March 15 lower high, the rally was weak. The odds therefore are that there will be a leg down tomorrow. Hence, today’s rally will probably be a bull leg in a trading range.
The next resistance is the all-time high, which is about 8 points above today’s high. Therefore, the bulls will try to break above it this week.
Even though breaking above the March 15 high weakens the bear case for the next few days, the buy climax on the weekly chart will probably limit this rally to 2 – 3 weeks. The odds still are that the Emini will fall below the weekly moving average within a month or so.
See the weekly update for a discussion of the price action on the weekly candlestick chart and for what to expect going into next week.
Traders can see the end of the day bar-by-bar price action report by signing up for free at BrooksPriceAction.com. I talk about the detailed S&P Emini futures price action real-time throughout the day in the BrooksPriceAction.com trading room. We offer a 2 day free trial.
When I mention time, it is USA Pacific Standard Time (the Emini day session opens at 6:30 am PST, and closes at 1:15 pm PST). You can read background information on the intraday market reports on the Intraday Market Update page.


