Emini bull flag at daily chart exponential moving average
updated 6:45 a.m.
The day opened with trading range price action at the top of yesterday’s weak bull channel. The bears want this to be a test of yesterday’s high and an early high of the day. Yet, the early dojis make a limit order open more likely. The odds are that the Emini will be in a range for the 1st hour or two. Furthermore, this open following yesterday’s weak rally make a strong trend day unlikely. Therefore, there will probably be at least one swing up and one swing down. The market is deciding which will come first.
Pre-Open Market Analysis
The Emini sold off yesterday on the open. Since it fell below last week’s low and last week was an ii sell setup on the weekly chart, it triggered a weekly sell signal.
While it sold off for the 1st couple of hours, it reversed up and closed above its low. In addition, it closed above last week’s low. Furthermore, it closed at the daily moving average, and not far below.
The bears triggered a weekly sell signal. The bulls rallied enough to close below the sell signal bar (last week’s low). In addition, the Emini is still in the middle of a 4 week tight trading range. Hence, the trading range is still in effect. Most days will therefore continue to have reversals instead of sustained breakouts. Traders will therefore look for swing trades up and down.
Overnight Emini Globex trading
The Emini is unchanged and it traded in a narrow range. Yesterday’s rally was in a tight bull channel and is therefore a bear flag. The odds are that the Emini will break below the channel today. Furthermore, it might have to break below the January 12 low before the buyers will buy aggressively. However, the odds still favor a new all-time high before a test of the August high.
If it closes below the December 30 low, it would trigger a double top sell signal. It would then probably continue down to the August high before buyers return.
EURUSD Forex Market Trading Strategies
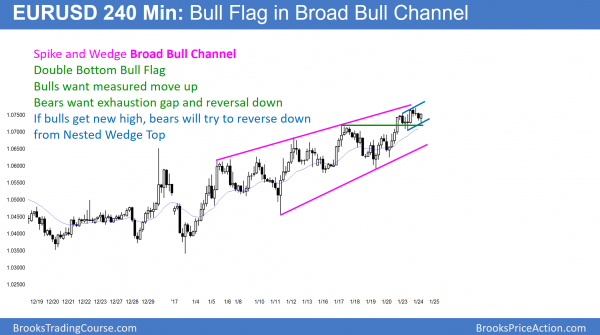
The EURUSD 240 minute chart is forming a 2 day double bottom bull flag.
The bulls want the gap above the 4 week wedge channel to lead to a measured move up. The bears want a reversal down from a lower high today or tomorrow. That would therefore be a 2 day Head and Shoulders Top. If there is a breakout above the bull flag, the bears would try to reverse the EURUSD down from a nested wedge top.
While the EURUSD 240 minute chart is in a bull trend, it is in a broad bull channel. There is therefore a 60% chance of a breakout below the channel and an evolution into a trading range. The bull have only a 40% chance of a bull breakout and an accelerated move up.
Overnight EURUSD Forex trading
The 60 minute chart of the EURUSD drifted down from a new high overnight. Yet, it has had a small rally from a higher low over the past 3 hours. Therefore it is still in its 2 day trading range within the month long bull channel.
Because it is now at the top of the channel, the odds favor a pullback within the next few days. Yet, this new high is different from the prior new highs because there is a gap below this trading range and the previous high from last week.
This creates stress and it increases the chances of the bull channel changing. The 2 possibilities are a bull breakout and a measured move up, or an exhaustion gap and a couple of weeks down to below the bottom of the channel. The odds favor the latter. Yet, there is a 40% chance of a bull breakout and a test of the December 8 major lower high before there is a pullback.
Summary of today’s S&P Emini futures price action and what to expect tomorrow
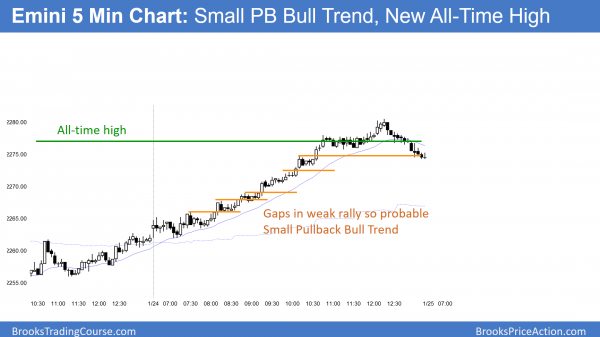
The Emini had a Small Pullback Bull Trend today. Because it traded above last week’s high after yesterday’s reversal up from below last week’s low, this is is an outside up week. Furthermore, it broke to a new all-time high. The 25 bar bull micro channel is a sign that the bull trend was very strong.
The rally to a new high today was strong. Therefore, the odds favor follow-through buying over the next several days, even if there is a pause or pullback for a day or two first. While a reversal can come at any time, it is unlikely when the momentum up is so strong.
See the weekly update for a discussion of the price action on the weekly candlestick chart and for what to expect going into next week.
Traders can see the end of the day bar-by-bar price action report by signing up for free at BrooksPriceAction.com. I talk about the detailed S&P Emini futures price action real-time throughout the day in the BrooksPriceAction.com trading room. We offer a 2 day free trial.
When I mention time, it is USA Pacific Standard Time (the Emini day session opens at 6:30 am PST, and closes at 1:15 pm PST). You can read background information on the intraday market reports on the Intraday Market Update page.


Al
At what time of the day, it would have been fair to infer that this is a small-pullback bull trend?
Also in hourly chart today’s move looks more like an exhaustion move. Is that a good observation?
Thanks
Since we are at the top of a T.R. (in 1 hour chart) and therefore in resistance área, cannot be just a leg in a T.R?