Emini in breakout mode awaiting Russia’s response to Syrian bombing
I will update again at the end of the day
Pre-Open market analysis
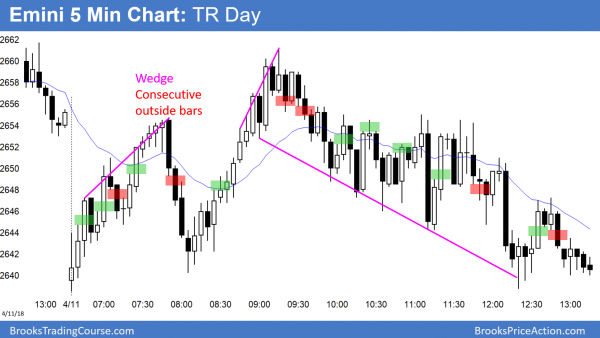
Yesterday was the second consecutive trading range day and a doji inside day. While it is at the top of a 3 week trading range, it is a weak sell signal bar. It is also a weak buy signal bar. Consequently, the odds are that the trading range will continue for at least another day.
The Emini is deciding whether the 3 month correction has ended or if there will be another leg down on the daily chart. Until there is a breakout of the 3 week range, there is no breakout. Consequently, traders expect reversals every few days. In addition, they are quick to take profits. As a result, there is a lot of trading range trading.
Overnight Emini Globex trading
The Emini is up 14 points in the Globex session. Yesterday’s selloff was in a broad bear channel. It was therefore likely a bull flag. Today will probably break above that bull flag on the open.
However, the bulls need a strong break above the top of the 3 week range before they will swing trade for a test back up to the March 13 major lower high around 2800. Until then, traders will expect that the trading range will continue, which means that most days will be sideways. This means that they will look for 2 – 3 hour swings up and down. Once there is a series of consecutive strong trend bars up or down, they will then hold positions for a trend trade.
Yesterday’s setups
Here are several reasonable stop entry setups from yesterday. I sometimes also show limit order entries and entries on the close of bars.
EURUSD pullback from 4 day rally
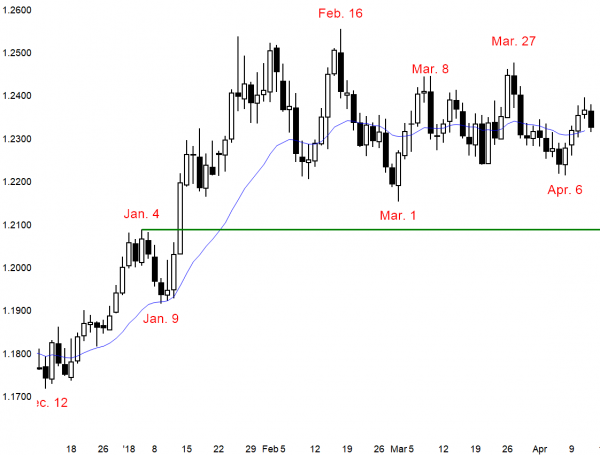
The EURUSD daily Forex chart rallied for 4 days and pulled back overnight. The bears will probably need at least a micro double top. This means that bulls will buy a 1 – 2 day selloff.
The EURUSD daily Forex chart pulled back after a 4 day bull leg in a 4 month trading range. The bears want a double top bear flag with the April 2 lower high. Yet, after 4 bull days, a 1 – 2 pullback is more likely. The odds favor at least a small 2nd leg up.
There is no sign of a breakout of the 4 month trading range. However, the range is constricting. It is therefore a triangle on the weekly chart. Since it is fairly tight, there will probably be a breakout within a few weeks.
Because the weekly chart is in a bull trend, the triangle is a bull flag. That means that the probability of a bull breakout is slightly greater. However, a triangle is a magnet. That is why the price stays in a tight range. As a result, once there is a breakout, there is usually a pullback to the triangle after 5 – 10 bars. Since the triangle is on the weekly chart, that means that the breakout will probably last about a month or two and then test the triangle again.
Possible Final Bull Flag
A bull breakout could lead to at trend reversal that lasts several months. This is because a triangle late in a bull trend is usually the final bull flag. Consequently, even if the rally reaches 1.30, traders will look for a reversal back down to the triangle. The entire process could take many months.
In the meantime, traders are taking quick profits after every 3 – 5 day leg up or down. Once there are consecutive trend bars breaking above or below the triangle, they will hold for a swing trade that could last many weeks.
Overnight EURUSD Forex trading
The EURUSD 5 minute Forex chart sold off 80 pips overnight. The bears are hoping that this is the start of a move down to below last week’s low. After a 4 day rally, it is more likely a 1 – 2 day pullback. The bulls will probably buy again around a 50% retracement, which is just below 1.23. Consequently, the odds are that the selloff will probably find buyers within 30 pips of the overnight low. Therefore, the selloff should transition into a trading range this morning. As a result, the bears will begin to take profits. Furthermore, they will sell rallies and switch to scalping.
Since the selloff on the 5 minute chart was strong, day traders will want a major reversal pattern before swing trading their longs. That would take at least a couple of hours to develop. The bulls will therefore scalp in the meantime.
Summary of today’s S&P Emini futures price action and what to expect tomorrow
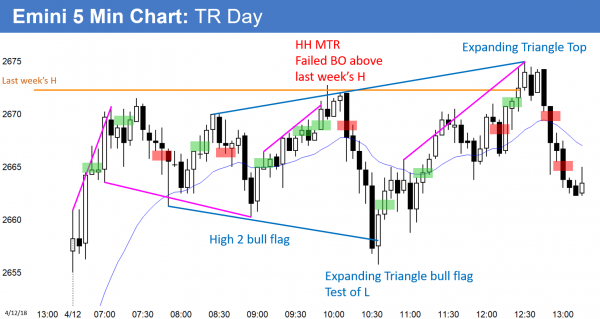
After a gap up and brief rally, today became a trading range day. It reversed down twice from above last week’s high.
Today was a trading range day. By going above last week’s high, it triggered a buy signal on the weekly chart. After selling off strongly to test the open, it reversed up from an expanding triangle bull flag. It failed a 2nd time and reversed down from an expanding triangle top.
The bulls will try to break above the 3 week range tomorrow. A gap up would create a 3 week island bottom. However, the bears will try for a reversal down. The probability now slightly favors the bulls.
See the weekly update for a discussion of the price action on the weekly candlestick chart and for what to expect going into next week.
Traders can see the end of the day bar-by-bar price action report by signing up for free at BrooksPriceAction.com. I talk about the detailed S&P Emini futures price action real-time throughout the day in the BrooksPriceAction.com trading room. We offer a 2 day free trial.
When I mention time, it is USA Pacific Standard Time (the Emini day session opens at 6:30 am PST, and closes at 1:15 pm PST). You can read background information on the intraday market reports on the Intraday Market Update page.


