Emini in breakout mode at 2800 ahead of FOMC today
I will update again at the end of the day
Pre-Open market analysis
Yesterday was another mostly sideways day. Traders are waiting for today’s 11 a.m. PST FOMC announcement. The bulls want a breakout above the March high and 2800. However, the bears always want the opposite. They want a double top with that high and then a strong reversal down over the next several weeks. The odds favor the bulls, even if there is a pullback for a couple of weeks.
Day traders will trade today like any other day. But, they should stop trading before the report. In addition, the up or down breakout on the report has a 50% chance of reversing sharply within 10 minutes. Therefore, day traders should wait at least 10 minutes after the report before resuming trading.
Overnight Emini Globex trading
The Emini is up 4 points in the Globex market. Since the past few days were sideways, today probably will be in a trading range as well. However, the odds favor a breakout up or down after the 11 a.m. PST FOMC announcement today.
Yesterday’s setups
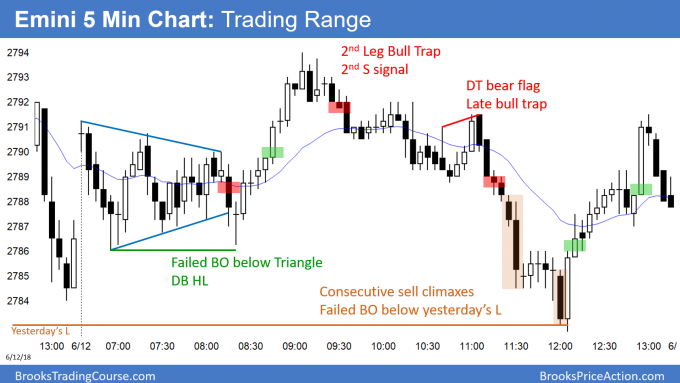
Here are several reasonable stop entry setups from yesterday. I sometimes also show limit order entries and entries on the close of bars.
EURUSD Forex double top bear flag in trading range ahead of FOMC
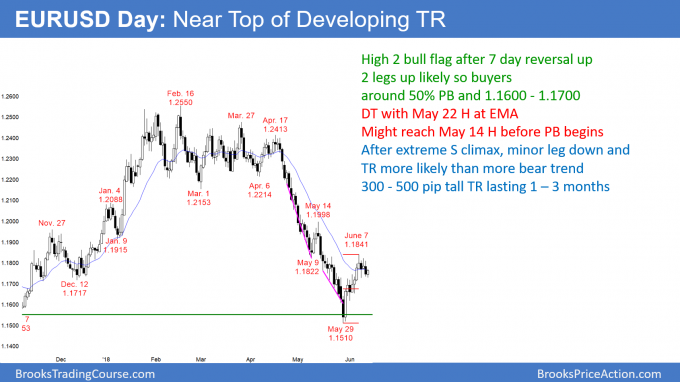
The EURUSD daily Forex chart reversed up to the EMA after consecutive sell climaxes. At least 2 legs sideways to up are likely over the next 1 – 3 months. The bulls have a High 2 bull flag, but today’s FOMC meeting is the more important than the chart patterns today.
The EURUSD daily Forex chart rallied strongly to resistance after sell climaxes. This is the 1st pullback to the EMA after more than 20 days and therefore a 20 Gap Bar sell setup.
But, when the pullback follows extreme sell climaxes, a minor reversal down and trading range are more likely than a resumption of the bear trend. The trading range will last at least a couple of months. Traders do not yet know if the EMA will be the top of the 1st leg up or if the leg will continue to 1.200 and the May 14 high.
Since today’s FOMC meeting is extremely important, it will probably create a breakout up or down. But, since the chart is now in a trading range, the bears will sell a bull breakout to around 1.20. In addition, the bulls will buy a 50% retracement of the 2 week rally. Furthermore, even if there is a new low, they will buy below the May low.
Overnight EURUSD Forex trading
The EURUSD 5 minute Forex chart reversed up from a selloff overnight. However, the range is only 40 pips. Because the 11 a.m. FOMC announcement is so important, the odds favor quiet trading into the report.
Day traders should exit all positions before the report. The breakout on the report has a 50% chance of reversing within the 1st 10 minutes. In addition, the breakout and reversal can be big and fast. Therefore, day traders should wait at least 10 minutes after the report before looking to day trade again.
Summary of today’s S&P Emini futures price action and what to expect tomorrow
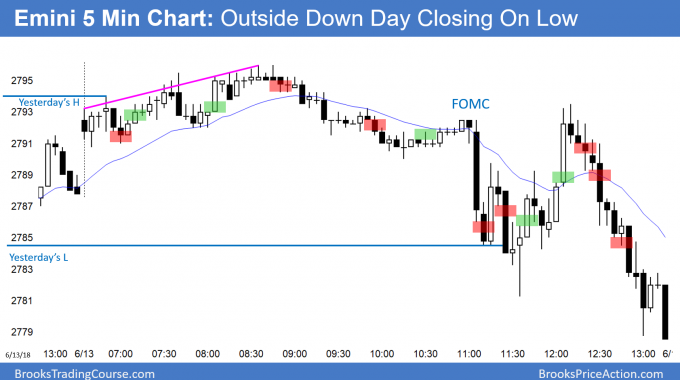
The Emini was sideways into the 11 a.m. PST FOMC announcement. It sold off to below yesterday’s low after the report, creating an outside down day. After a failed rally, it closed below yesterday’s low.
The Emini has a 5 day parabolic wedge top on the daily chart. Today was an outside down day, and it closed above yesterday’s low. It is a sell signal bar for tomorrow. If tomorrow is a big bear trend day, the Emini might trade down for the next couple of weeks.
The bears want the week to close below the open to create a bear body on the weekly chart. In addition, they would like the week to trade below last week’s low. That would be an outside down week and a sign of strong bears.
The odds still favor a gradual move to a new high. However, the odds are that there will be several 2 – 3 week selloffs along the way. This might be the start of one. However, unless there is a strong selloff, the odds are that the Emini will break above that high within a couple of months.
See the weekly update for a discussion of the price action on the weekly candlestick chart and for what to expect going into next week.
Traders can see the end of the day bar-by-bar price action report by signing up for free at BrooksPriceAction.com. I talk about the detailed S&P Emini futures price action real-time throughout the day in the BrooksPriceAction.com trading room. We offer a 2 day free trial.
When I mention time, it is USA Pacific Standard Time (the Emini day session opens at 6:30 am PST, and closes at 1:15 pm PST). You can read background information on the intraday market reports on the Intraday Market Update page.


Hey Al, I asked a question about GBPUSD in the trading room that you mis-understood. I’m in London so was trading your nighttime. The bars on your chart looked totally different to mine, probably because a wide spread and nobody trades GBPUSD with your broker at that time. I get 0.8 pip spreads on GBPUSD.
Anyway my question was:
“Was trading GBPUSD during the european session. There was a HLMTR around 8am EST. I thought it was a 50% pullback/Bear flag, expecting trend resumption I held short. Ended up giving back all my profits. How can I recognise was a HLMTR? There was no trendline break.”
I put a chart here to illustrate:
https://1drv.ms/f/s!Ajlj7dTld4OYgf86_ol2iSzo59lxqA
Kevin,
I’m no Al Brooks, so take this for what it’s worth. I don’t think your trend line held price very well as there were consecutive sell climaxes (wedge bottom) that broke way below your TL. The 10 am rally would be your countertrend rally that broke strongly through the EMA (instead of the TL). I think you were correct to look for trend resumption, but when that L2 failed then you should have been on alert that this was the LHMTR. Awesome short at the beginning of the day btw.
Dave
Hey Dave thanks for your input. I appreciate any guidance at all, and I’m not sure if Al will even see this…. When you say trendline do you mean channel line (lower line in a bear channel)? Maybe that was my mistake… drawing the trendline but not the channel line? And when the lower channel line was broken it was an exhaustive sell climax? Is that what you mean?
If you drew a steeper trend line with the first point being the 2nd point on your tread line, there was a break. Trend lines are subjective, and you can only know the most optimal trend line after the fact. Also the “HLMTR” was testing the breakout area and the move up to what was your 3rd touch was very strong. The market was also telling you it was finding support in that area. it went sideways for an hour. You seemed to ignore all the clues that the market was giving you, and only consider the information that supported your belief that it was going to go lower.
I think the more important question you should be asking, which only you can answer, is why did you not exit the trade when the market told you your analysis was incorrect? I’m not suggesting you post an answer to this, but just trying to give you something to think about.
Yep, you’re right!! I think because I got greedy. I’ve never caught such a good swing before I just wanted it to go on and on. Thanks for the insight!
Kevin,
Some good responses to your question, and this is a summary of what I see. First, beautiful short! Trend lines are not absolute and there may be several which may be operating at the same time and it is difficult to know which one will take effect. If you use a lower trendline off of the left side of the pattern you will see that the trendline was broken, but more importantly than a trendline is momentum into and away from pattern supports (trendlines and highs and lows). From the bottom of the pattern you were expecting at least a small reversal soon, but also a retest (absolutely agree). Please note the 10 bar micro channel coming up from the bottom. This is a warning. It is very direct and relentless for a period of time. While you expect another test down (and the trap did form from the trendline you have drawn), that is the potential second leg. It had 5 bars down and then began to retrace. With the bearish dojis (bull followed by bear) of note is that the pattern it attempting to push, but note the tails on bottom as well as this is potential support based the previous bars. This is a potential warning, and with the pattern not following through on either bar immediately, you should be open that the price may reverse at any time. With the bull bar that followed (after three successive unsuccessful attempts), I believe bears would exit there and wait for more information. The second leg began off the trendline you have drawn and finished at two pushes down (the second push was much weaker and failed on the bull reversal bar).
Last aspect. The push up from the bottom created a decisive MAG (moving average gap bars – a series of them). This often means that the next push down, may be the final attempt before a reversal (whether it is a HL or a LL).
Hey Eric! Great Analysis! Al said pretty much the same in his response. Great extra insight on the Moving Average Gap bars. Wow, so many clues where there. Its so clear in retrospect.
How long have you been trading the Al Brooks methods if you don’t mind me asking? Seems like you’ve got a great grasp of things.
Kevin – Thank you! I take this quite seriously, and it is my passion. It took me over a decade to find a reliable source that is accurate, technical, and very descriptive. I’ve been involved with Price Action for 3.5 years and have reviewed more than 100k charts. This year it all “clicked”. Having just about finished the trading course (new one) for the 2nd time, all I can say is that it is the best thing to learn what is really happening. Just a WOW in detail. I also recommend reviewing Al’s daily free chart postings where he has marked up the trades. These are reliable second entries. A great tip, if you were in the trading room today, is to only make decisions on bar closes. It highly simplifies the “game”. Keep at it, the journey is worth it.
I’m currently going through the course for the second time myself. Certain videos I’ve done a few times. I’m having quite a few “aha, so THAT’s why I got stopped-out of that trade the other day – doh” moments. So I’ve quit trading yesterday and today and am going to try to get through most of the videos again over the next 4 days.
Have you seen the new videos on breakouts? Theres 8 of them – yes EIGHT! Oh the number of times I’ve gone “omg its buy the close” as price raced up only for it to turn around. Al explains it all – its GOLD!!
I just put some text on your chart:
I think the steeper trend line better highlights the strength of the trend over the past 50 bars. The 1st rally is minor, but this one was an 8 bar bull micro channel with many big bull bodies closing near their highs. There was a 70% chance of at least a 2nd leg up, and therefore the bulls would look for a reversal up at around a 50% pullback. The bulls got a small double bottom higher low. I would call it a higher low major trend reversal.
Most bears would have exited above the bull doji at the low because there was a triangle and a wedge, and several big bull bars. Many would not have sold the 2nd entry short at the top of the strong minor reversal because the leg up was so strong. Those who did got out above a bull bar at around a 50% retracement. The bulls would buy above a bull bar, especially a 2nd entry like today (the small green box).
All major reversal setups have a 40% chance of an actual reversal into an opposite trend. The 1st leg up was strong and therefore this one may have had a 50% chance of a bull trend.
Hey Al! Thanks for responding!!
Makes perfect sense now. I think I wasn’t expecting the trend line to get steeper, I guess this indicates an unsustainable acceleration in price, so I should have been primed for a reversal. All the signs were there, now that you’ve explained it.
I noticed you’ve marked up the chart to add to your slide deck. I put a clean one in my onedrive link for you without my original comments. GBPUSD trades really well. I love it a lot more than EURUSD.
https://1drv.ms/f/s!Ajlj7dTld4OYgf86_ol2iSzo59lxqA
Thanks again for taking the time to explain.
By the way, I noticed your GBPUSD chart looked terrible in the European session with your broker’s spread.
Here’s a link to a better one in case you need it in the future
https://www.tradingview.com/chart/?symbol=FOREXCOM:GBPUSD&interval=5
And some Intraday charts of Global Indicies if you’re interested (you said once before you had no access to Dax or Nikkei Data)
https://www.tradingview.com/chart/?symbol=XETR:DAX&interval=5 (Dax)
https://www.tradingview.com/chart/?symbol=TVC:UKX&interval=5 (FTSE100)
https://www.tradingview.com/chart/?symbol=TVC:NI225&interval=5 (Nikkei 225)
https://www.tradingview.com/chart/?symbol=HSI:HSI&interval=5 (Hang Seng)
Tradingview is free, but you’ll need to register an account after you’ve visited a few charts.
seeya later in the trading room!
Hi Al,
you mentioned on your other site that you invested in cryptocurrencies, creating a portfolio. That was around a month ago. With the prices dropping significantly since then,what is your strategy ? Are you adding on as prices drop,exiting some or all positions with a loss, or just holding on ? Thank you,
Michael.
I am holding because I thought that there might be a selloff to around the February low, I will exit if there is a strong breakout below that. I plan to add if there is a strong reversal up from the current selloff.