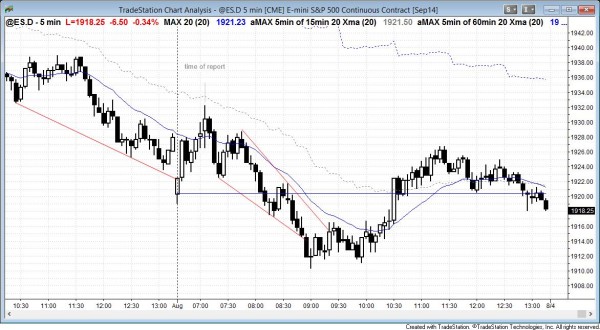
I posted this chart after the close. Yesterday formed a huge bear breakout on the daily stock market charts. After an early, big rally today, the Emini fell to a new low of the day. Whenever a rally goes that far above the open, there is a lot of buying pressure, and that reduces the chances of a strong bear trend day. After the big selloff, the odds favored a trading range day with a close near the open. The key factor today was whether the close would be above or below the open, creating either a bull or bear bar on the daily chart. The close was slightly below the open. This created a small bear body and it gives traders more confidence in yesterday’s bear breakout because the bear close confirms yesterday’s breakout.
Posted 7:02 am PST.
The most important Emini price action in today’s intraday market update is the start of a stock market bear trend reversal after yesterday’s strong breakout. Although the daily market is in a bear trend, yesterday was a sell climax. The odds favor a rally at some point that will last at least 20 bars. The reversal up on the open was strong and it might be the start of the rally. The market is always in long today and the bulls will try to get at least two legs up to yesterday’s triangle apex at around 1937. Bulls will buy any test down for a second leg up and a possible higher low major trend reversal. Because this might form an early trading range, the test down might be deep and reach yesterday’s low. If it falls below and reverses up, this would form an expanding triangle, which is an lower low major trend reversal. The bears want this rally to be a lower high in a bear channel, but the odds favor the bulls. Since yesterday was so strong, the rally will probably evolve into a trading range. The end of the day is important because bears want a bear body on the daily candle chart.
Today is the follow-though bar on the daily chart and its close is important. The bears want a bear body, which traders will see as confirmation of the bear breakout and increase the odds that the market will fall for a measured move. The bulls want they opposite. They want today to be a strong bull reversal day so that traders will consider the possibility that yesterday was a failed bear breakout and a bear trap. The size of yesterday’s bar, the close on its low, the close below more than a month of bars, and the higher high major trend reversal on the daily chart all increase the chances that this is the start of at least a “TBTL” correction, which is Ten Bars and Two Legs as a minimum goal.
Today is Friday, but there are no weekly support or resistance targets other than the daily moving average at 1906. Yesterday’s low and close are targets on the daily chart, as is the June 12 low at 1917.50. This is the bottom of the channel that followed the strong breakout up that began on May 21. Once the Emini tests the bottom of the channel, it usually enters a trading range.
Yesterday’s strong bear breakout was so strong that there will be trapped buyers above. July closed on its low, which means that it closed below the low of every earlier bar in the month. It actually closed below the lows of more than the past 40 days. That means that everyone who bought during the past 6 weeks is holding a losing position. The size of the bear breakout was so big that these bulls know that lower prices and a measured move down are likely. These trapped bulls will use any 20 – 40 point rally to sell out of their longs, hoping to reduce their losses. Bears who were waiting for a sign of strength found it yesterday, and they, too, will use any rally to short. The result is that a second leg down is likely.
I have been saying that my minimum target was the 1890 area, but yesterday was such a strong breakout that any measured move down will probably fall below that level. The monthly chart is still bullish. Even though the daily chart might fall 5 – 10% (it might fall much more), it will still probably only be a 2 – 5 bar pullback on the monthly chart, which is in a small pullback bull trend. The first reversal down in such a strong trend is usually bought and the stock market usually needs at least a double top before a bear trend begins. Sometimes a bear trend can begin with simply a huge bear breakout, but this has not yet happened on the monthly chart and probably would require a fast move down of about 200 – 300 points, which is not likely at the moment.
See the weekly update for a discussion of the weekly chart.
Traders can see the end of the day bar-by-bar price action report by signing up for free at BrooksPriceAction.com. I talk about the detailed Emini price action real-time throughout the day in the BrooksPriceAction.com trading room, and a 2 day free trial is available.
When I mention time, it is USA Pacific Standard Time (the Emini day session opens at 6:30 am PST, and closes at 1:15 pm PST). You can read background information on the intraday market reports on the Intraday Market Update page.

