Emini all-time high, awaiting FOMC interest rate announcement
Updated 6:55 a.m.
The Emini opened near yesterday’s low, and with consecutive bear bars. This makes a bull trend day unlikely. In addition, after 3 bull days, each getting weaker, today will probably be a trading range day or a small bear day. Another bull day is unlikely after a a 3 day rally that is getting weaker. There is support around the lows of the past 2 days and the gap below Tuesday’s low. This is also around the 60 minute moving average.
The bulls want an opening reversal up from below yesterday’s low and then a rally to above yesterday’s high. Even if they get their outside up day, the odds are against today being a strong bull day. The bears want a strong break below support. Yet, after 3 decent bull days, this is unlikely. The odds favor a trading range day.
Since the Emini is near support, it will probably turn up within an hour or two. However, a 2 – 3 hour rally will probably be a bull leg in a trading range day. If it falls to the 60 minute moving average over the 1st hour, the selloff will probably be a bear leg in a trading range day. As is usually the case, when a trading range day is likely, the Emini often goes sideways for an hour or more as it decides on the direction of the 1st leg in the trading range.
Pre-Open market analysis
The Emini again was in a trading range yesterday, as it was for most of the past 3 days. It might continue sideways into next week’s FOMC announcement. Yet, the bears will scale into shorts at new all-time highs on the daily chart. This is because the 7 month rally has been in a broad channel. In addition, the bulls prefer to buy pullbacks than breakouts.
Overnight Emini Globex trading
The Emini is down 7 points in the Globex market. Three consecutive bull trend days is a lot in a bull channel. Therefore the odds are that today will not be a bull trend day. Furthermore, the rally has been getting weaker over the past 3 days. This makes a bull trend day unlikely today. Consequently, today will probably be either a bear day or a trading range day.
Yesterday’s setups
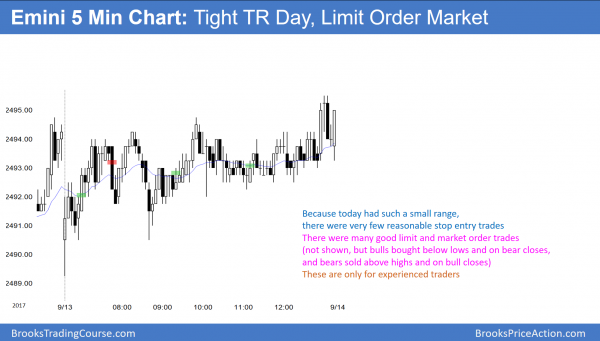
Here are several reasonable stop entry setups from yesterday. I sometimes also show limit order entries and entries on the close of bars.
EURUSD Forex market trading strategies
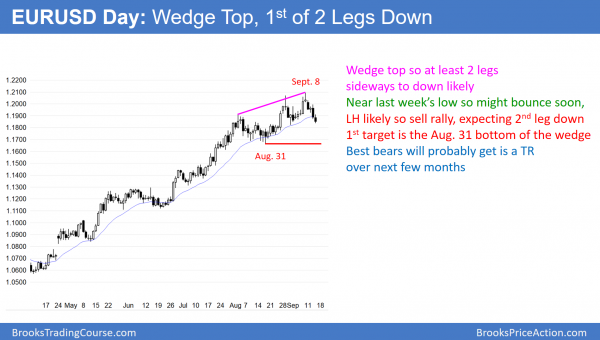
The EURUSD daily Forex chart is turning down from a wedge top. Since it is near a higher low and the moving average, it is at support.
Yet, a wedge reversal typically has 2 legs down and therefore bears will sell the 1st rally.
The EURUSD daily Forex chart is turning down from a wedge top. In addition, it is at the resistance of the 1.2000 Big Round Number, and the bottom of a trading range on the monthly chart. Furthermore, it is at a measured move up on the daily chart. The selloff over the past week is a sign that the wedge top is likely to achieve its minimum goal of 2 legs down. Because the 1st leg down is unfolding, the odds are that traders will sell any 2 – 5 day rally.
This is because they expect the 1st reversal back up to fail and lead to a 2nd leg down. A reasonable target for the bears is the bottom of the wedge, which is the August 17 low. If it gets there, the bulls will try to rally from a double bottom with that low. However, the bears will continue to sell rallies, hoping for a strong break below the wedge bottom. They would then look for a measured move down to the next support. That is at the top of the 2 year trading range. This is around 1.1600. In addition, it is about a 50% pullback from this year’s rally.
Because the bull channel on the daily chart is tight, the odds are that even a 400 pip selloff to 1.1600 will simply be a bear leg in what will probably be a big trading range. However, after several months in a range, the bears will have a chance to create a credible major top. Consequently, the downside risk over the next several months is a big trading range, and not a bear trend.
Overnight EURUSD Forex trading
The EURUSD 5 minute chart sold off over the past 30 minutes, but bounced 30 pips. It is testing the support of the August 31 low, which is the bottom of a 3 week trading range. Furthermore, the 1st leg down has lasted 5 bars on the daily chart. That is enough bars in a wedge this size to be at or near the end of the 1st leg down. Consequently, traders will look for the market to stabilize for a few days, and then rally for a few days. Therefore, the bulls will start to buy selloffs, expecting a 100 – 150 pip rally at some point over the next week.
Traders might wait for next week’s FOMC report to get the rally. In any case, because the bears have a reasonable 1st leg down and the selloff is at support, they will take profits and look to sell a 100 – 150 pip rally. This is because they expect a lower high and then a 2nd leg down.
Since both the bears and the bulls expect the selloff to evolve into a trading range and then a 150 pip rally, both will buy selloffs and sell rallies for a few days. The bears will buy back shorts below lows and the buys will sell out of longs above highs. The result will probably be a trading range for a few days.
Summary of today’s S&P Emini futures price action and what to expect tomorrow
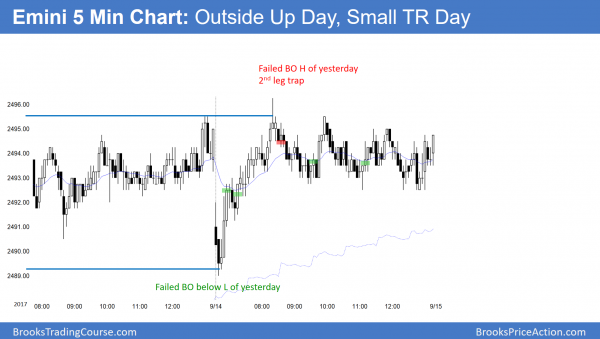
The Emini formed a small outside up day today, but spent most of the time in a tight range.
The Emini formed its 3rd consecutive small tight trading range day. While it made another all-time high, there was no follow-through buying. It is probably waiting for next week’s FOMC interest rate announcement before it breaks out up or down.
See the weekly update for a discussion of the price action on the weekly candlestick chart and for what to expect going into next week.
Traders can see the end of the day bar-by-bar price action report by signing up for free at BrooksPriceAction.com. I talk about the detailed S&P Emini futures price action real-time throughout the day in the BrooksPriceAction.com trading room. We offer a 2 day free trial.
When I mention time, it is USA Pacific Standard Time (the Emini day session opens at 6:30 am PST, and closes at 1:15 pm PST). You can read background information on the intraday market reports on the Intraday Market Update page.


Hi Al,
The good limit order trades for selling new high and buying new lows for yesterday tight range in the emini (~ 5 – 6 points range) suited for experienced traders.
Is the limit order trades applicable for wider ranging markets, like 8 – 10 points range in the emini?
At the H and L of every bar, and at every prior H and L, stop order traders bet on breakouts and limit order traders bet on reversals. Therefore, half of all profitable trades are from stop orders and half are from limit orders. If the context is good for a reversal, limit order traders will trade regardless of the size of the range.