Posted 7:10 a.m.
The Emini gapped above the bull flag at the end of yesterday, but not above yesterday’s high or the 60 minute moving average. Although the early rally triggered the buy signal on the daily chart, it was a weak breakout above yesterday’s high. The rally on the open had small overlapping bars, and it was a limit order market. This is more likely a bull leg in a trading range than the start of a bull trend. The odds are that the rally will fail at the 60 minute moving average and the Emini will reverse down to test yesterday’s close. This early trading range price action increases the chances of a trading range going into the FOMC report.
If the bulls break strongly above the 60 minute moving average, the Emini could trend up for 2 – 3 hours. However, the trading range price action make a lot more trading range price action likely.
Pre-Open Market Analysis
S&P 500 Emini: Day trading FOMC price action
The FOMC announcement is at 2 p.m. today, giving traders an opportunity for day trading FOMC price action. The Emini usually has a big move after the report. The 1st move fails 50% of the time and then reverses. There is a 50% chance of a trend after the report and a 50% chance of a trading range, which usually has at least a couple of big, fast moves.
Because of the size of the bars, which means that price is moving fast, and the 50% chance of a reversal within the 1st 2 – 3 bars, most traders should not trade until at least after the close of the 2nd bar. If they choose to trade, they should plan to trade a small position because the bars are big, which means that the stop is far away. Also, the big bars mean that the market is moving fast, and the gives traders less time to make decisions. This increases the chance of mistakes and lowers the probability of a profit.
The first several hours of the day are usually like any other day. Most traders should stop trading 30 – 60 minutes before the report and then wait for the report. This is because the Emini often enters a tight trading range before the report and there is a 50% chance of being trapped into a losing trade and only a 30% chance of making 2 or more points in that hour before the report.
The 60 minute chart is oversold and around a 50% pullback from rally that led to the June 8 all-time high. The 5 minute chart ended with a double bottom. The bulls want a breakout above and a measured move up. The bears see yesterday’s 5 hour trading range as a double top bear flag or a big Low 2 sell setup. The Emini is in breakout mode. Support is yesterday’s low and resistance is yesterday’s high and the 60 minute moving average.
Because the 60 minute chart is oversold, the odds are against a big move down tomorrow before the report. The big double bottom might lead to a trend up, but more trading range price action is more likely. Traders should be open to anything. If there is a big breakout up or down, they will swing trade. Without that, yesterday’s trading range and today’s report create enough uncertainty to make traders mostly scalp until there is a strong breakout.
The Emini is up 5 points in the Globex session. If the day session opens here, that would be a continued breakout above the neck line of yesterday’s double bottom on the 5 minute chart. The bulls want a measured move up and the bears want a failed breakout.
After 4 days of lower prices and a reversal at the end of yesterday, today will probably trade above yesterday’s high, triggering a minor buy signal on the daily chart. However, with the 5 day bear micro channel, the 1st reversal up will probably be l limited to a day or two and then traders will sell it for a test back down.
Forex: Best trading strategies
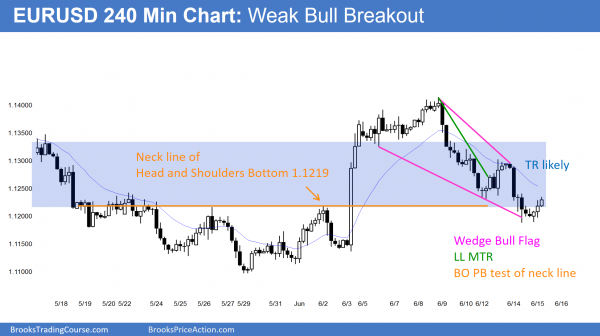
The EURUSD 240 minute Forex chart is trying to turn up from a higher low and a bear channel. There is a Lower Low Major Trend Reversal pattern and a wedge bull flag. The overnight rally has been weak.
The EURUSD 60 minute chart is oversold. It is holding above the June 3 bottom of the strong bull breakout. The bulls are trying to create a lower low major trend reversal and a wedge bull flag. The 3 pushes down for the wedge are the lows of June 5, 12 and yesterday.
The EURUSD Forex market is up 20 pips in a weak rally in the European session. The rally on the 60 minute chart lacked consecutive big bull trend bars so it is more likely a leg in a trading range than a breakout above the 6 day wedge bull flag.
Because of the uncertainty surrounding today’s 11 a.m. FOMC report, traders will be inclined to take quick profits. If there is a strong breakout up or down, they might take a swing trade. They should consider stopping trading around 10 a.m. and then waiting for the report.
Since there is usually a big move after the report, but the 1st move has a 50% chance of reversing, it is usually better to not take any trades until at least 10 minutes after the report. There is a 50% chance that the report will be followed by a trend up or down, and a 50% chance of a trading range. The bars are usually big, which means that stops are far away, so day traders should trade small.
Summary of today’s S&P Emini futures price action and what to expect tomorrow
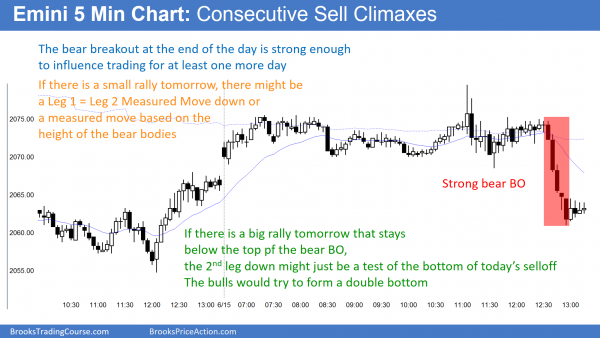
The Emini had an unusually small reaction to the FOMC report, staying in a tight trading range until the end of the day. It then broke strongly down to below yesterday’s close.
The FOMC report was followed by a selloff at the end of the day. The daily chart is still oversold and might bounce for a day or two, but the odds are that the Emini will get down to the May low by the end of July. It still might make one more new high 1st, but a strong bull breakout is unlikely. Since it is in the middle of its 2 month range and it is stalling, it probably will bounce and go sideways for the next couple of days.
A big bear breakout like this usually has follow-through for the next day or so. It often leads to a measured move down based on the open of the 1st bear bar to the close of the last bear bar in the sell climax. Less likely, it will reverse up and rally for a measured move above. Traders know that the odds favor a 2nd leg down, even if there is a protracted rally on the open tomorrow. If there is a small rally, traders will look for a Leg 1 = Leg 2 move down. If there is a 3 – 4 hour bull channel tomorrow, the 2nd leg down might simply test today’s low and form a double bottom.
See the weekly update for a discussion of the price action on the weekly candlestick chart and for what to expect going into next week.
Traders can see the end of the day bar-by-bar price action report by signing up for free at BrooksPriceAction.com. I talk about the detailed S&P Emini futures price action real-time throughout the day in the BrooksPriceAction.com trading room, and a 2 day free trial is available.
When I mention time, it is USA Pacific Standard Time (the Emini day session opens at 6:30 am PST, and closes at 1:15 pm PST). You can read background information on the intraday market reports on the Intraday Market Update page.


Thank you Al.