Posted 6:45 a.m.
The Emini opened with a big gap down, far below the moving average. It is trying to test below the May 24 bull breakout bar. Whether or not it gets there early today, the Emini will probably be mostly sideways for the 1st 2 hours. That is what typically happens when there is an unusually big gap.
This is because the price is too far below average and traders prefer to sell higher. Bears know that the upside is limited and they will sell every rally. Bulls know that the downside is probably limited and they will buy every selloff.
It always is possible for the big gap to be the start of a big trend day up or down. There often is a strong move up or down for the 1st 5 – 10 bars. However, the most likely price action will be a trading range for 2 hours. Once the Emini is closer to the moving average, it will in breakout mode. It will therefore decide between trend reversal up and trend resumption down.
Pre-Open Market Analysis
S&P 500 Emini: Day trading a strong bear breakout
The selloff at the end of yesterday was strong. As a result, it should influence the market for at least one more day. This will give traders a chance at day trading a strong bear breakout and its follow-through. A big bear breakout usually leads to a measured move, and it can come in many forms.
The move could be a Leg 1 = Leg 2 move. It could also be based on the height of the bear leg. Furthermore, it could be based on the distance from open of the 1st bar of the sell climax to the close of the final bar. Because the Emini fell strongly, there is a 60% chance that the measured move will be down. In addition, the bulls want a rally above the top of the sell climax. They have less than a 40% chance of success today because the Emini is already down 10 points overnight. If they succeed, traders will begin to think that the measured move might be up instead of down.
The May 24 big bull bar started the current rally to the all-time high. Because it was a big bull trend bar, it was a buy climax. Today will probably test its low since that is what usually happens when a reversal is close. The next target is the May low, and I have been talking about it for a month.
In conclusion, nothing has changed on the daily chart. I have been writing for the past month that a trading range is more likely than a breakout. There is a 60% chance of a test of the May low in June or July. This remains true. The odds of one more new high before the test down are now only 40%.
Forex: Best trading strategies
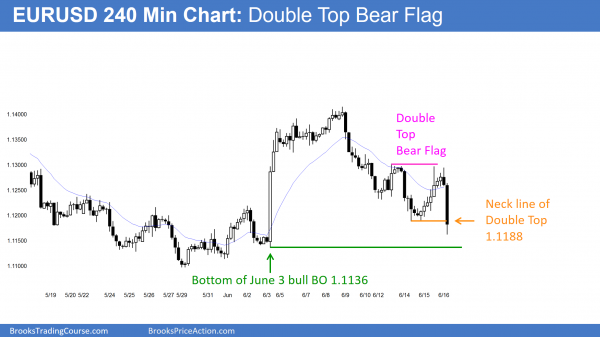
The 240 minute EURUSD Forex chart is breaking below the neck line of a double top bear flag.
The 240 minute EURUSD Forex chart reversed up from its higher low wedge bull flag yesterday. A bear trend or a continued trading range is more likely than a bull trend. The bears got a breakout below the neck line of the double top bear flag overnight. They therefore want a measured move down. The target would be below the May 30 low. Consequently, they would then look at the next support. That is the March 16 bottom of the pullback from the March 10 bull reversal.
The bulls want the overnight bear breakout on the 240 minute chart to fail. Since it is a 3rd push down, it is a potential wedge bottom. However, the EURUSD is so close to the June 3rd bull breakout low, it will probably have to test closer. The bulls need a reversal up today or tomorrow so the wedge bottom could trigger.
On the daily chart, the bulls see a wedge bull flag. The 1st 2 pushes down were Friday and Tuesday. They expect a rally above the June 9 lower high of around 1.1400. This is unlikely over the next few weeks. Since the daily chart is still in a trading range, it might come after a test below the May 30 low. A reversal up at that point would create a wedge bull flag. The 1st 2 pushes down are on April 25 and May 30. While possible, it probably would not come for several weeks.
The bears see a lower high major trend reversal on the daily chart. They therefore want a break below the May 30 low of 1.1097 lower high since that is the neck line. The April 12 rally makes this also a Head and Shoulders top.
Because all of the reversals on the 240 minute chart were coming sooner and after smaller legs up and down, the daily EURUSD Forex chart was in Breakout Mode. Most noteworthy, the breakout took place overnight and it was down. There is therefore better than a 60% chance of a swing down to the May 30 low.
In addition, there is a 40% chance that the overnight bear breakout will fail and reverse up. Because the 5 hour selloff had a series of 3 sell climaxes over the past 2 hours, a trading range is likely on the 5 minute chart. This is especially true because of to a nested wedge on the 5 and 240 minute charts. The bear breakout on the 240 minute chart is also a 3rd push down.
In conclusion, the 1st reversal up on the 60 minute chart will probably be minor. This means that it will probably be sold and be followed by a trading range. That bear rally might have begun with the reversal up at 5:20 this morning. The selloff overnight was climactic. Therefore, at least 2 hours of sideways to up trading are likely early today.
Summary of today’s S&P Emini futures price action and what to expect tomorrow
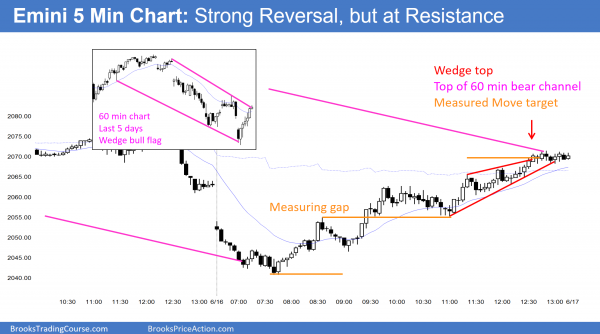
The Emini sold off to the bottom of a bear channel on the 60 minute chart. It then reversed up from a lower low. It rallied strongly and reached a measured move up from a gap in the middle of the day. It also reached the top of the bear channel and broke above the 60 minute moving average.
The Emini had a strong bull reversal today. It formed a bull reversal day on the daily chart. It is also a higher low and a micro double bottom. It is a buy signal for tomorrow.
Although the Emini will probably bounce for 1 – 3 days, the odds still favor a test of the May low within the next month or so. Today’s buying was in a series of buy climaxes. A bull channel is a bear flag. This channel had converging lines and was therefore also a wedge top.
Although the Emini might gap up and rally tomorrow, there is only a 25% chance of a strong bull trend day. Due to the strength of the rally today, there might be follow-through buying for the 1st hour or two. Because today was climactic, there is a 75 % chance of at least 2 hours of sideways to down trading tomorrow.
See the weekly update for a discussion of the price action on the weekly candlestick chart and for what to expect going into next week.
Traders can see the end of the day bar-by-bar price action report by signing up for free at BrooksPriceAction.com. I talk about the detailed S&P Emini futures price action real-time throughout the day in the BrooksPriceAction.com trading room, and a 2 day free trial is available.
When I mention time, it is USA Pacific Standard Time (the Emini day session opens at 6:30 am PST, and closes at 1:15 pm PST). You can read background information on the intraday market reports on the Intraday Market Update page.


Hi Al, hope all is well,
Al when you talk about probability like 25% chance of this or 75% chance of that
happening the next day or three or couple of hours , did you do a statistic test based on patterns or
it’s just based rough experience.
Al thanks for sharing it’s means a lot
mark azeard
Hi Mark,
Allow me to answer for busy Al. Al’s read is based on his extensive experience, close to 30 years, and yes, he did do much back testing and stats in the early days (Al is a math grad too). But if you study the Ask Al extracts he will tell you that back testing, and spending time building indicators, is a waste of time. His read is now based on his experiences and memory/intuition. Everything you need is in the chart.
This will come to us all if we put in the hard work.
Hope that helps.
These are my conclusions after about 10,000 hours of computer testing of all kinds of ideas.
I don’t pay attention to fundamentals. Every institution has its own interpretation. I wait to see if more money goes into buying or selling, and then trade. The charts tell me who owns the market. I think it is a mistake to assume some magical ability to understand the fundamentals better than the institutions so that you will know what they will do before they do. Too many pundits on TV talk about the fundamentals when they trade Forex. I think they are fools. If it goes up, I buy. If it goes down, I sell. The rest is useless to me.
Hi again Al. Sorry. I didn’t ask the question precisely – it was your TECHNICAL read of the chart i was interested to hear. i have followed you too long to know your views on fundamentals :-). best wishes
Thank you Al for all your commentary. Based on the Brexit issue, i would be interested to hear your view on GBP/EUR, if you have time. thanks again