Posted 7:01 a.m.
The Emini reversed up sharply after a dip below the bottom of the FOMC bull reversal, and became Always In Long. The bears tried for an Opening Reversal down from the moving average and a 50% pullback, but the rally was strong enough to make this a low probability bet. It is higher probability to wait to sell until after there are several consecutive bear bars.
Although the bulls are in control, the Emini is stalling at resistance in the middle of its 2 day trading range. Also, the Big Up, Big Down candlestick pattern created by the FOMC report and today’s gap down make a trading range likely soon. Unless the bulls can get stronger follow-through buying or the bears can get a strong bear reversal, the odds are that the Emini will spend at least a couple of hours, and possibly most of the day, in a broad trading range. There is no top yet, and the Emini has plenty of room to the magnets of yesterday’s high and close, but the odds are against a strong breakout above that resistance.
Pre-Open Market Analysis
S&P 500 Emini: Day traders see candlestick pattern as final flag top
The Emini had a strong reversal up after yesterday’s FOMC report. It is down 14 points in the Globex session. Online day traders see the candlestick pattern as a final flag top.
For the past week, I have discussed 2 opposite forces influencing the next couple of weeks. First, the reversal down on the daily chart after last week’s test of the July all-time high never tested back up. Usually reversal from important resistance requires a test, which creates a double top. The test can come within a few bars and form a micro double top. It also can come after 50 or more bars and form a big double top.
The 2nd force has a 90% chance of success and is therefore much more important. The weekly chart has been in a bull micro channel for 11 weeks. This has only happened twice in the past 10 years, and there has not been a single micro channel lasting more than 13 weeks. This means that there is about a 90% chance that there will be a pullback on the weekly chart within the next 3 weeks. A pullback simply means that the low of the week falls below the low of the prior week.
Since the Emini is currently near this week’s low and there are only 2 days left to the week, next week will probably trade below this week’s low and end the bull micro channel. Traders will buy puts or put spreads as far above this week’s low as they can. It would be better it they get a chance to buy at when the Emini is at least above 2081 so that they will have a chance of at a put profit of 0.50 or more if the drop is next week. If it is not next week, they can buy a small enough position to add on 10 – 20 Emini points higher. The puts should expire at least 4 weeks out to allow for another 2 weeks up in the microchannel.
The overnight reversal down could simply be a 2nd leg down after the April 17 rally. If you remember, on April 20, I said that the pullback would probably be a TBTL Ten Bar Two Leg pullback after a buy climax on the daily chart. Alternatively, the overnight selloff could be a bear breakout below the 2 month channel, and the start of the reversal down after the early April Final bull flag. As with all breakouts, traders have a better idea after the close of the 2nd bar, which means after tomorrow’s close. Is this a successful bear breakout and the start of a swing down (“Sell in May and go away”), or is it going to be a failed breakout that will be followed by 1 more test of the July high before there is a Final Flag reversal?
If today becomes a strong bear trend day, and it might, the odds that the Final Flag reversal down on the daily chart is already underway are higher. If today is not a strong bear trend day, then the odds might be 50-50 that there might be one more test up before the reversal. The daily chart is obviously in a bull trend and does not have to reverse. However, the weekly chart makes at least a 1 – 2 week pullback that begins within the next 3 weeks very likely.
Because today has the potential to be a big bear trend day, traders should look for possible big bear swing trades. Whenever there is a bear swing on the daily chart, the Emini often stays somewhat neutral until the final 1 – 2 hours and then falls in a small pullback bear trend. Traders need to be ready for a big swing down at the end of the day, even if it does not look likely for most of the day.
Can today be a big bull trend day? Of course, but that is less likely after being sideways for 2 weeks in an overbought market. The Emini has had many trading range days over the past 2 weeks. This means that there was at least one bull swing and one bear swing. This is probably the most likely candlestick pattern today. However, remember that there might be a surprisingly big selloff at the end of the day.
Forex: Best trading strategies
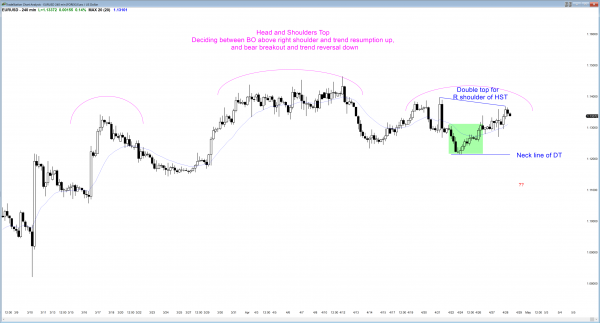
The 240 minute EURUSD Forex market chart is in Breakout Mode.
The EURUSD Forex market’s daily chart is in a relatively tight trading range. As I have been writing for the past week, it is in breakout mode. Bulls want a breakout above the April 21 lower high, which is the right shoulder of the Head and Shoulders top. They then want a breakout above the April 12 top of the range and then a 200 pip measured move up.
The bears want the 4 day rally to form a double top lower high major trend reversal with the April 21 high. They then want a breakout below the April 25 neck line, followed by a 200 pip selloff.
Until there is a breakout, both bulls and bears will take quick profits. The EURUSD has been in a 20 pip range overnight, which means that the only traders who made money overnight were scalpers.
On the 60 minute chart, the location is good for the bears because the rally is only about 50 pips below the resistance of the April 21 high, and 150 pips above the bottom of the April trading range. However, until there is a breakout, there is no breakout, and the probability is the same for the bulls and the bears.
Summary of today’s S&P Emini futures price action and what to expect tomorrow
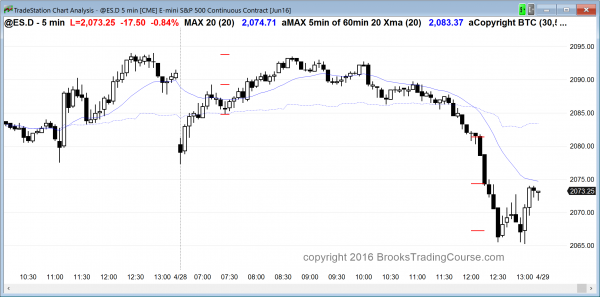
The Emini rallied from above yesterday’s low to just below yesterday’s high, and then entered a trading range. It then reversed down to a new low of the day in a big sell climax, and traded below last week’s low.
Tomorrow is the last day of the month. The bulls would like the month to close above the July all-time high. The Emini is probably too far for that to happen.
I have been writing for about a week that there was a 90% chance of a pullback within the next 3 weeks on the weekly chart. Today fell below last week’s low so the minimum objective was met.
The late sell climax was so extreme that the odds are that there will be at least a 2 hour sideways to up move that starts by the end of the 2nd hour tomorrow. There is a 50% chance of follow-through selling in the 1st hour or 2, but only a 25% chance of a strong bear trend from the open.
See the weekly update for a discussion of the price action on the weekly candlestick chart and for what to expect going into next week.
Traders can see the end of the day bar-by-bar price action report by signing up for free at BrooksPriceAction.com. I talk about the detailed S&P Emini futures price action real-time throughout the day in the BrooksPriceAction.com trading room, and a 2 day free trial is available.
When I mention time, it is USA Pacific Standard Time (the Emini day session opens at 6:30 am PST, and closes at 1:15 pm PST). You can read background information on the intraday market reports on the Intraday Market Update page.


