Posted 6:57 a.m.
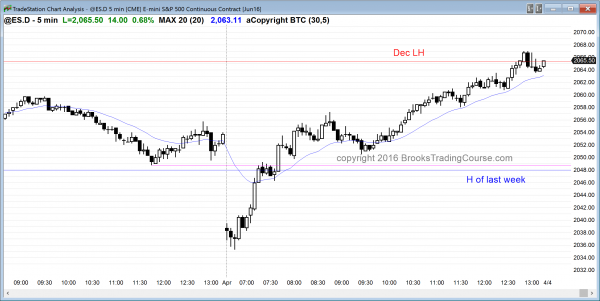
The Emini opened with a big gap down and 3 bear bars, but both had big tails below, and bull scalpers made money buying at the low of the prior bar. That is not what typically happens in a bear trend. It increases the chances of the Emini being mostly sideways to up for the next couple of hours until it gets closer to the moving average. Once there, it will decide between trend resumption down and trend reversal up.
Although the bulls got a reversal up on the 4th bar, the limit order bears made money selling the close of the bull breakout bar. With both limit order bulls and bears making money early, the odds of a lot of trading range price action are high. Although the Emini is barely Always In Long, it will probably be sideways to up to the moving average over the next hour or two in a limit order market. If there is a strong breakout up or down at any point, traders will switch to swing trading. Until then, they will mostly scalp. Since a trading range day is now likely, there will probably be at least one swing up and one swing down today.
Pre-Open Market Analysis
S&P 500 Emini: Candlestick pattern is a 2 day island top
The Emini tested the lower of the 3 November/December highs this week, and turned down from 3 ticks below. Traders see the Emini as in a broad bear channel as long at it continues to make lower highs, which it has since July. However, it is also in a trading range. When the market gets that close to a cluster of resistance levels at the top of a trading range, it usually has to go above at least one. This means that there is at least a 50% chance at the moment of the Emini going above that December lower high before it enters a trading range for the next month or two.
It is possible that Wednesday’s reversal down from a slightly lower high, is all that the bulls get, and the Emini has formed a lower high double top. There is still about a 30% chance that this rally will continue up to a new all time high without a significant pullback or trading range.
Turning down from the breakout above last week’s high on the daily chart is important because it is the 1st time that the Emini began to show signs of a failed breakout since the rally began in February. There is a 60% chance of a trading range for at least the next month, and a failed breakout is one of the earliest signs of a transition from a bull channel into a trading range.
The Emini still might go a little higher, but the odds still favor a trading range for at least a month. This means that bulls will take profits at prior highs and bears will short there, instead of bulls buying the breakouts and bears buying back shorts.
There was no reaction to today’s unemployment report. The Emini is down about 9 points. It might gap down below yesterday’s low and form the 2 day island top that I mentioned a few times this week. If it does, it is important for the bears to keep the gap open because it would increase the chances that the trading range has begun. The 4 other trading ranges within the 2 year big trading range were all 100 to 150 points tall, so that is a reasonable guide of what to expect with this one, if it has begun.
Although it is possible for a bull trend to reverse into a bear trend without first forming at least a 10 – 20 bar (day) trading range, that happens only about 25% of the time. If the Emini begins to accelerate down and starts to have strong breakouts below the higher lows of the past 2 months, it could be happening this time. The odds are greater that any selloff will disappoint the bears, and the result will be a trading range before the Emini can enter a bear trend, if it will enter a bear trend on the daily chart.
With the past 2 days being small dojis and the lack of a big move on the report, the Emini is telling us that the price is just about right. The bears want a big bear trend day on the gap down. The bulls want the gap down to immediately reverse up. Day traders will wait to see what we get. If there is a trend from the open up or down, they will swing trade. More likely, the open will be a trading range for an hour or 2. If so, online day traders will look for a double or wedge top or bottom and stop entry. Without that, they will wait for a breakout. While waiting, they will scalp, and many scalps will be with limit orders and scaling in.
Forex: Best trading strategies
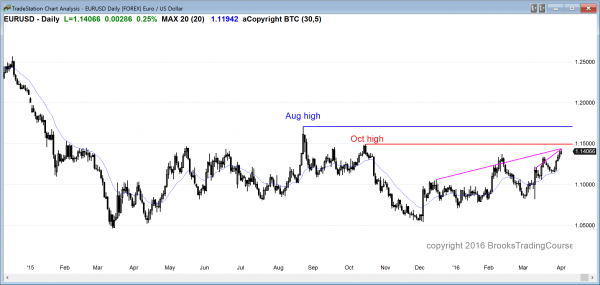
The daily chart of the EURUSD is in a nested wedge rally that is testing the top of the trading range.
The EURUSD has rallied for 5 days, and has formed a nested wedge, as I showed yesterday. As strong as the rally has been, it is still below the October high. If it turns down, traders will see this as a double top bear flag. If it breaks out, the bulls will then still need a strong breakout above the August highs before traders will believe that the trading range has converted into a bull trend.
The nested bull flag extends down to the 60 minute chart, which had its 3rd push up last night. Although it turned down an hour ago, last night’s rally was in a tight enough bull channel to that this reversal down will probably be bought. The bears will probably need at least a micro double top before then can get a 1 – 2 day pullback. The 5 minute chart has been in a big 50 pip triangle for the past hour. When the bars are big like this, it is difficult to trade. The risk is big because the bars are big. The probability is low because of the reversals. Traders should wait for the bars to become smaller and for clarity, which means either a breakout up or down, or an obvious trading range where the legs last 10 or more bars.
The 1st target in a wedge reversal is the most recent higher lows, which are around 1.1370, and then 1.1300. The market usually finds support at these higher lows, and then enters a trading range, which is likely over the next few days. At the moment, a trend day is unlikely, but if one unfolds, traders will swing trade. Until then, they should wait until the bars get smaller and the legs last more than just 2 – 3 bars.
Summary of today’s S&P Emini futures price action and what to expect tomorrow
The Emini gapped down and created a 2 day island top, but then rallied above yesterday’s and formed an outside up day.
The Emini was in a strong bull trend today, and it also traded above the December lower high. There were 2 higher lower highs in that 3 month trading range. If it gets above the 3rd, the odds are that it will then go above the all-time high of 2100.
Today was a buy climax, but the Emini is so close to the all-time high that it might reach a new high next week. The day after a buy climax has a 50% chance of follow-through buying on the open, but a 75% chance of at least 2 hours of a trading range that begins by the end of the 2nd hour. There is a 25% chance of a relentless bull trend that would not go sideways for two hours. If that happens, the Emini could reach a new all-time high next week.
See the weekly update for a discussion of the price action on the weekly candlestick chart and for what to expect going into next week.
Traders can see the end of the day bar-by-bar price action report by signing up for free at BrooksPriceAction.com. I talk about the detailed S&P Emini futures price action real-time throughout the day in the BrooksPriceAction.com trading room, and a 2 day free trial is available.
When I mention time, it is USA Pacific Standard Time (the Emini day session opens at 6:30 am PST, and closes at 1:15 pm PST). You can read background information on the intraday market reports on the Intraday Market Update page.


Hello Al.
Thank you for the update . Regarding EUR/USD I would like to ask you the probability of the bull to get breakout above the Oct high .
My general thought is that until there is a breakout, there is no breakout, which means that, in general, I think the odds are against breakouts when mkts are in trading ranges. However, this rally has been very strong, so it is probably about 50-50 right now.
Thanks a lot.