Buy climax intraday trading techniques: I will post around 7:01 a.m.
The Emini opened with a trend from the open bull trend. There is a 25% chance of another strong bull trend day. This is the 18th consecutive 60 minute bar without a pullback. There is a 75% chance that this bull breakout above yesterday’s bull channel will fail within the 1st 5 bars. I am writing on the 5th bar. The odds are that the Emini will put in an early high of the day.
This rally is a parabolic buy climax from yesterday’s 1 pm bar. I would not buy for at least 5 – 10 bars because there is a 75% chance of a sideways to down move starting within the 1st 2 hours. This parabolic wedge top makes an early high even more likely.
If the bears get a series of consecutive bear bars, they will convert the Emini into Always In Short. Usually when there is a parabolic wedge top and then a reversal, the reversal begins as a tight bear channel. It is usually just a tight trading range that is sloped down. It usually lasts for an hour or so. It sometimes lasts for 2 or more hours. When it does, traders watch for a bear breakout. If it comes, it often is a measuring gap.
Buy climax intraday trading techniques
S&P 500 Emini: Pre-Open Market Analysis
The Emini this week had the strongest rally of the year. The 60 minute chart has a 17 bar bull micro channel. That happens only once every several years. It was therefore unsustainable and climactic. However, climaxes usually lead to trading ranges and not reversals. Because the 60 minute chart is so overbought, the odds favor a trading range that might last for a couple of days.
As I said last weekend, the last week of June is one of the most reliably bullish weeks of the year. I said that, despite last Friday’s huge selloff because that is the math. Yet, this was much stronger than I thought likely. There is no sign of a top. Traders were buying at the highs all week. As a result of this strong demand to buy, they will probably buy the 1st pullback on the 60 minute and daily charts. Hence, the best the bears will probably get on the daily chart over the next few days is a trading range.
Globex
The Emini was sideways for most of the night, but has rallied over the past 2 hours. Because yesterday was a buy climax day, there is a 50% chance of follow-through buying in the 1st 2 hours. Yet, there is only a 25% chance of another strong trend day. There is a 75% chance of at least 2 hours of sideways to down trading that begins by the end of the 2nd hour.
As a result of today being a Friday, weekly support and resistance can be important. Last week’s high was 2106.75. If today rallies above that, this week would be an outside up week. The bulls would like that because it is a sign of strength. However, the bears were disappointed last week at the low. The bulls were disappointed when May failed to become an outside month. Despite how strong this week has been, traders will assume that the rally will disappoint the bulls. Hence, the odds are against forming an outside up week.
Forex: Best trading strategies
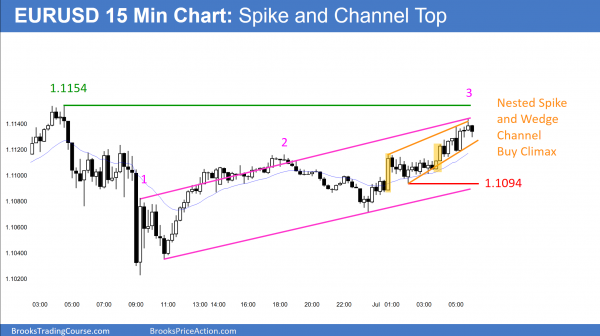
The EURUSD 15 minute chart rallied overnight. However, the candlestick pattern is a wedge after a bull breakout. It is a nested a Spike and Channel Bull Trend, which is a type of Buy Climax. As a result, a trading range is likely to follow today.
After rallying for 4 days on the daily chart, the EURUSD Forex chart had an outside down day yesterday. The bears see the rally as a pullback from a huge bear breakout. Hence, it is a bear flag.
The bulls also believe it is a bear flag. They, however, think that last Friday’s bear breakout in an oversold bear trend was an exhaustive sell climax. It was big so the bears therefore might get one more new low. However, the bulls think that it will be the start of a trading range rather than the beginning of a new leg down.
Daily, weekly, and monthly charts
Yesterday was the last day of the month. June was a big doji bar and therefore a trading range bar. Today is the last day of the week. The week so far is an inside bar and it has a bull body. There is no nearby weekly support or resistance.
On the daily chart, yesterday was the entry bar for a breakout below a 3 day bear flag. Yet, it was a doji bar, which was a weak bar for the bears. As I have been writing since last weekend, the sell climax in the EURJPY is the easier chart to see what is happening. It is in an exhaustive sell climax. The EURUSD has the same pattern. Because the EURUSD daily chart is in a trading range, last week’s selloff appears less climactic. However, the underlying force is the same. The odds are that the daily chart will be in a trading range for 1 – 3 weeks. The bears will see it as a bear flag. The bulls will see it as a reversal of a sell climax. Usually, they each would have a 50% chance of being right.
Trading ranges are resistant to breakouts. Therefore, the odds are that the breakout will fail. Strong breakouts have a better chance of success than weak breakouts, but the follow-through has been bad. As a result, the odds are slightly better for the bulls.
European session
As I wrote last weekend, the EURUSD chart was likely to be sideways for several weeks. It has been sideways all week. It rallied 70 pips over the past 7 hours, but the rally is the 2nd leg up in a trading range. It is also in a wedge channel and there is a nested Spike and Channel Bull Trend. Hence, this is a buy climax. The odds favor a bear breakout below the bull channel, and then a trading range.
The EURUSD is testing the top of the range, but there is still room for a little more rally. Trading ranges resist breakouts. As a result, the odds are that the rally will be a bull leg within the week long trading range. This means that it will probably begin to trade sideways to down.
A trend up or down can begin at any time. There is no sign of one at the moment. The 5 minute chart is at the top of a wedge channel after a bull spike at the start of the European session. The odds are that the EURUSD will break below the bull wedge channel and begin to form a trading range today.
Summary of today’s S&P Emini futures price action and what to expect tomorrow
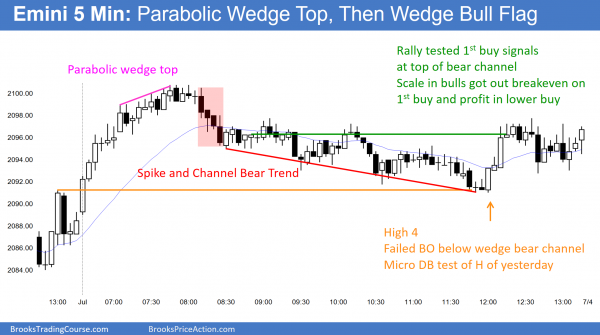
The bulls got follow-through buying on the open. It ended with a parabolic wedge top. This was followed by a wedge bear channel and a reversal back to the middle of the range.
The Emini rallied to test 2100 where it formed a parabolic wedge top. The bears finally got a pullback after a 19 bar micro channel on the 60 minute chart. The bulls were so eager to buy that they did not wait for a pullback. Now that they finally have a pullback, the odds are that the Emini will be sideways for the next several days.
See the weekly update for a discussion of the price action on the weekly candlestick chart and for what to expect going into next week.
Traders can see the end of the day bar-by-bar price action report by signing up for free at BrooksPriceAction.com. I talk about the detailed S&P Emini futures price action real-time throughout the day in the BrooksPriceAction.com trading room, and a 2 day free trial is available.
When I mention time, it is USA Pacific Standard Time (the Emini day session opens at 6:30 am PST, and closes at 1:15 pm PST). You can read background information on the intraday market reports on the Intraday Market Update page.


Al,
I just wanted to say thank you for the amount of detail you are putting on the charts in your end of day commentary.
The new format looks great! Thanks for all you do to help people learn how to trade.
Enjoy the holiday weekend,
Alan
Al,
“This rally is a parabolic buy climax from yesterday’s 1 pm bar”. Are you referring to the 60 minute chart? By parabolic you mean the climax price is at the top of the parabola and it should subsequently fall in symmetry to the rise? If so what is the indicator that this is in fact a climax? Tks.
I could give a very long answer, but I am trading. For me, a parabolic buy climax is 3 pushes up in a tight channel. It is a common form of top in the 1st hour. I am writing at 8:56. Another parabolic wedge formed and triggered on the 5 minute chart.
The 60 minute chart has a 19 bar bull micro channel. The 1st hour was a big bull trend bar. All big trend bars are climaxes. The 60 minute chart had a pair of big bull bars late yesterday. That was another climax. Consecutive buy climaxes have a higher probability of pulling back to the bottom of the most recent buy climax (the low of the 1st hour today). A micro channel is a buy climax. It is also a sign of strong bulls. The bulls usually buy that 1st reversal down. Climaxes are usually followed by trading ranges.