Buy climax before Comey’s Russia and Trump hearing
Updated 6:49 a.m.
The Emini opened in the middle of yesterday’s trading range at the 60 minute moving average. Furthermore, yesterday was a weak buy signal bar on the daily chart. Therefore, if today rallies above yesterday’s high, the breakout probably will not lead to a strong bull trend. In addition, if the breakout reverses down, that would form an expanding triangle top.
The 1st bar was a bear bar and the 3rd bar was a doji. These are signs that the rally that began at the end of yesterday is more likely a bull leg in a trading range. They increase the odds that today will continue the trading range price action of the past 2 days. With the uncertainty of Comey’s Thursday’s speech, the odds are against a strong trend today. Yet, if there is a strong breakout up or down, traders will swing trade.
While the Emini is Always In Long, yesterday’s selloff and the rally since yesterday’s close creates a Big Down, Big Up pattern. As a result, there is Big Confusion, and the odds therefore favor a trading range for the 1st hour or two, and then a trading range day.
Pre-Open market analysis
The Emini was in a small range for most of yesterday. It sold off into the close. This was probably the result of some profit taking before Comey’s hearing on Russia and Trump on Thursday. Since the weekly chart is in an extreme buy climax, there is an increased chance of a strong reversal down.
Overnight Emini Globex trading
The Emini is up 1 point in the Globex market. Today will probably continue the trading range of the past 2 days. This is because the Emini is getting neutral before the Comey hearing on Thursday. Since Comey has a history of making shocking statements, there is an increased risk of a big move during the hearings that begin on Thursday.
EURUSD Forex market trading strategies
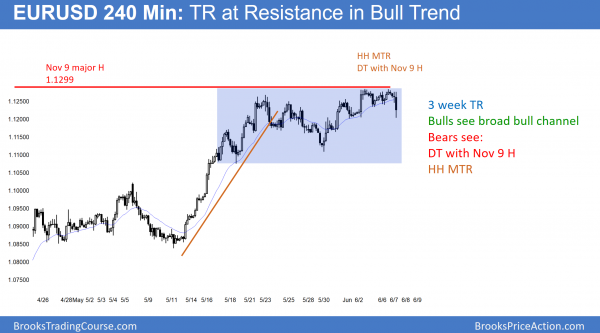
The 240 minute EURUSD Forex chart is in a broad bull channel. It is also in a 3 week trading range, and therefore the bears have a reasonable top as well.
The EURUSD Forex market rallied from a 15 year low this year. Furthermore, the current rally on the weekly chart was a lower low major trend reversal. The rally is now testing the November 9 major lower high. In addition, most major reversals lead to trading ranges and not new trends.
The momentum up is strong enough to make a break above that high likely. Yet, the bears want a lower high. This is because the monthly chart is still in a bear trend, and lower highs are a sign that the strong down trend is strong.
Trading ranges disappoint bulls and bears. The bears will be disappointed by a break above the November high. Yet, the bulls will be disappointed if the rally then fails to break strongly above the 2 year range. Since trading ranges continue indefinitely, the odds are that the Emini will get above the November high, but not far above the 2 year high.
Overnight EURUSD Forex trading
The EURUSD Forex market sold off 70 pips overnight. But, it has been in a 30 pip range for the past 3 hours. Since it is still in a 3 week trading range, there has been bad follow-through after strong moves up and down. While the selloff might be a start of a move down to the bottom of the range at around 1.1200, most day traders are mostly scalping.
The momentum down last night was strong enough so that the 2 hour rally will probably fail. Consequently, bears will sell the rally. Yet, they will probably take profits near the overnight low. All financial markets will probably be mostly sideways before Thursday’s Comey hearing.
Summary of today’s S&P Emini futures price action and what to expect tomorrow
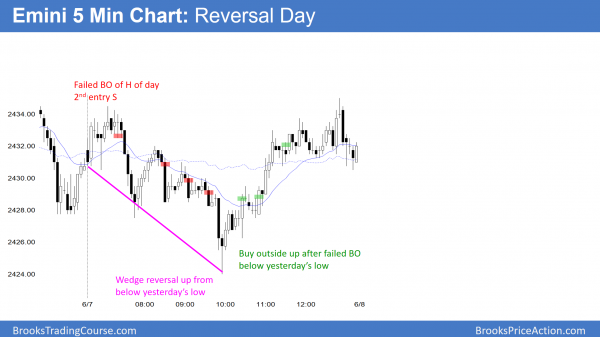
The Emini traded below yesterday’s low and then back to the open. It was therefore a reversal day and a trading range day.
Today was the 3rd sideways day. Traders are neutral going into Comey’s testimony tomorrow. Because of Comey’s history of making surprise comments, there is an increased chance of a trend day tomorrow.
See the weekly update for a discussion of the price action on the weekly candlestick chart and for what to expect going into next week.
Traders can see the end of the day bar-by-bar price action report by signing up for free at BrooksPriceAction.com. I talk about the detailed S&P Emini futures price action real-time throughout the day in the BrooksPriceAction.com trading room. We offer a 2 day free trial.
When I mention time, it is USA Pacific Standard Time (the Emini day session opens at 6:30 am PST, and closes at 1:15 pm PST). You can read background information on the intraday market reports on the Intraday Market Update page.


ok my apologies
I’ll just add that setups on these charts look consistent with teaching. 1st trade one of Al’s favorites 2nd reversals in TR at top of TR. On 3rd trade, well, you have to be thinking fast, expecting such move and moving around stop entry order.
I quickly create the charts at the end of the day. I understand how it can be frustrating to look at these charts. Many months ago, I was only putting major reversals on the charts, but changed because traders requested that I show more signals. I now put several reasonable setups, even though most beginners would not take most of those signals.
In general, if a leg up or down is strong and a trader is looking to enter a reversal, it is better to wait for a 2nd signal or a strong reversal (like 3 consecutive bull bars after a bear swing). When looking for a 2nd entry, it is better to have a signal bar in your direction (a bear bar when looking to sell).
I would like to comment on 1st signal entry short marked in todays chart ,as 2nd entry short failed BO of day.
I assume Al has people to take care of updating chart as its impossible for him to do it all.
Do not wanna sound negative, but I think these entries actually confusing beginners and giving them wrong idea of trade probability. Whoever does it, I think is missing half of the story of Al Brooks complex price action teaching, even if its meant for guidance only.
Look at the 1st marked entry, yes we have 2nd failed BO/micro DT, but above MA in TTR, so do you really wanna sell using stop order. I guess you can say you can sell for swing any time.
Or 3rd marked signal in chart – short L2 (2 legs correction to MA) anyone who traded it knows it happened so quick it was pretty difficult to take a trade.
And I could go on and on. These marked entries feels like advert how well it works and taking away perception of risk/reward and probability.
I’m sure these charts are done by Al.
It’s my understanding that Al is pointing out some of the reasonable stop entries that were available today…not necessarily the highest probability trades.
Hi Jiri,
As Alan says, Al most certainly does create all charts himself. Nobody else involved.
Given that Al had already said above that “…the odds therefore favor a trading range for the 1st hour or two, and then a trading range day.” all those setups make clear sense. The market, each leg, will move either side of the MA, as it did today, so not good to think a short above MA is not going to work. Trading range action.
Ref third setup happening too quick, Al uses the 5 minute chart to give time for such setups to appear. Plenty of time really, and a 1 tick pullback in this case would have helped you enter.
Just my 2 cents.