Posted 6:58 a.m.
The Emini opened with small bars and prominent tails at the 2100 resistance level. Bulls and bears made money in the 1st few bars. This is a limit order open, and the Emini might stay sideways for an hour or more while it waits for a breakout up or down. The Emini is at key resistance, but the magnet of the April high is strong with today being the last day of the month, and unless the bears can clearly take control, the odds are that the bulls will test that level at some point today.
Pre-Open Market Analysis
S&P 500 Emini: Bullish price action and possible outside up candlestick pattern
The Emini has rallied strongly over the past week after a failed breakout below the April low. Today is the last trading day in May. The momentum up last week was strong enough for traders to expect follow-through buying, even if there is a pullback first. That follow-through buying might come today because traders see how close the April high is. It is therefore a magnet on the last trading day of the month.
April was a sell signal bar on the monthly chart. The sell triggered when May dipped below the April low. The sell signal bar was weak, and as I had said many times during the weeks leading up to the sell signal, the odds were that there would be more buyers than sellers once the sell signal triggered. The rally off the February low on the weekly and monthly charts was so strong that the odds were that the bulls would aggressively buy as any sell signal triggered. The strong momentum up told us that the bulls were very strong and that they would overwhelm the bears below the April low.
April had a small range. Whenever a sell signal bar is weak and small, traders have to be thinking about a reversal up from below the bar that might then break above the high of the bar. May is very close to doing that, and the odds are that it be successful today.
On the last day of the month, traders start thinking about what is likely to come in June. If May becomes an outside up month (trading below April and then above April), and the candlestick is not too big on the monthly chart, and May does not close in its high, traders will look for June possibly being an inside month. This means that June might open right below the May high, and then trade down, but stay above the April low.
When there is a failed breakout above a trading range and the bears trigger the sell (like they did when May traded below April), and the sell fails, traders will look again to sell if there is a 2nd signal. That 2nd sell signal has a higher probability of begin profitable.
There are many ways that a 2nd sell signal can look. After an outside up bar, a common one is an ioi sell setup. This means that June might be an inside candlestick on the monthly chart. Since this has about a 40% chance of happening, traders will place trades in anticipation. For example, if May is trading above the April high and the all-time high late in the day today, some bears will begin to sell, in case June becomes a bear inside bar. These bears are betting that June will open near the May high, not trade above May, and then trade down and form an inside bar on the monthly chart once June finally ends. If July then trades below the June low, that would be a 2nd sell signal for the failed breakout above the 2 year trading range. Even if June trades below the May low or 1st above the May high, it would create a micro double top and still be a 2nd entry sell as it fell below May. Some traders would wait to sell in July using a stop 1 tick below the June low.
What if today closes 10 – 20 points above the all-time high? That would create a possible measuring gap on the monthly chart, and it might be the start of a strong rally. The bears would be watching for follow-through buying. If there is none, they will begin to sell, and bulls will begin to take profits. The big June bar might then be an exhaustive sell climax instead of a measuring gap. For traders to see June as an exhaustion gap (the gap would be between the June close and the May high), they need the gap to close. If it does and if there is a strong reversal down in June to below the April low again, online day traders will then look for a measured move down, based on the 80 point height of the 3 month trading range.
The Globex market is up 3 points and at the important 2100 round number. Today can be an important day because it is the last day of the month and May might close outside up and at a new all-time high. However, traders know that the Emini has been in a trading range for 2 years, and the odds are that the bulls will be disappointed about something at the end of the day. Online day traders should be prepared for anything, including a huge bear trend day, but the odds are that the Emini will test the all-time high and not close far above it.
Forex: Best trading strategies
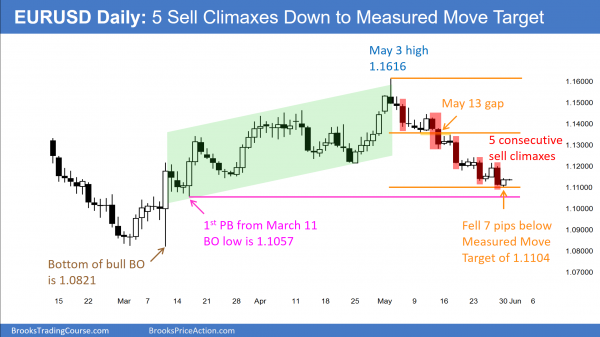
After a Spike and Bull Channel, the EURUSD daily Forex chart has fallen in a series of 5 sell climaxes to the bottom of the channel, and 7 pips below the Measured Move target.
Whenever there is a selloff to support and the selloff comes in a series of 4 or more big bear trend bars with little correction on the way down, there is a 60% chance of a TBTL Ten Bar Two Leg reversal up from the support. The overnight reversal came after the EURUSD fell 7 pips below the Measured Move target and 3 pips below the 1.1100 round number. Although there is still about 40 pips more room to the March 16 bottom of the channel, the reversal at support after 5 consecutive sell climaxes make it likely that the EURUSD daily chart will begin to correct up this week. The reversal up will probably last a couple of weeks and test resistance levels above, like the May 13 gap, which is about a 50% pullback from the May selloff and 200 pips above the current price.
Since the selloff has been in a tight channel, the 1st reversal up will probably be minor. This means that it will be probably be sold, and the best the bulls can expect over the next few weeks is a trading range. While it is possible that the minor reversal can lead to a bull trend, or that the selloff can keep forming lower and lower sell climaxes, neither is likely. The EURUSD is in a buy zone for a trade up over the next 2 – 3 weeks.
The EURUSD is up 35 pips overnight. It has had a 2 legged rally up from Friday’s low. However, there is not yet a strong bull breakout and it is still in a broad bear channel. The context is good for the bulls to get a 200 pip rally, but they need either a reliable bottom or a strong bull breakout before most traders will be willing to swing trade their longs.
The bears know that the odds of much more down are getting small, and they will start taking profits on selloffs. They have been taking them at new lows. Because of the sell climaxes and the support, they might soon start taking them above the prior low. If they do, that could create a higher low major trend reversal and signal the start of a 200 pip rally. While it is possible that the channel down could continue for much longer and even accelerate down, the odds are against it.
Summary of today’s S&P Emini futures price action and what to expect tomorrow
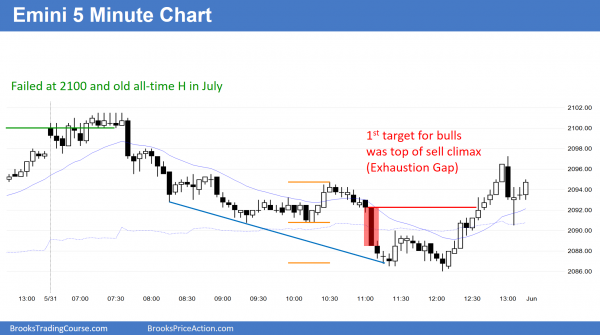
The bears got an outside down bear trend day, but there was a late exhaustion gap (big bear bar) followed by a strong rally to test back up to near Friday’s high.
The bulls were hoping for an outside up month, but failed. I said that whatever happened today, there would probably be disappointment for the bulls because the Emini is at the top of a trading range. The rally over the past week is strong enough so that today’s reversal down will probably be bought within a day or two.
May is now a buy signal bar on the monthly chart because it is a pullback from the April breakout above the top of the 2 year trading range.
See the weekly update for a discussion of the price action on the weekly candlestick chart and for what to expect going into next week.
Traders can see the end of the day bar-by-bar price action report by signing up for free at BrooksPriceAction.com. I talk about the detailed S&P Emini futures price action real-time throughout the day in the BrooksPriceAction.com trading room, and a 2 day free trial is available.
When I mention time, it is USA Pacific Standard Time (the Emini day session opens at 6:30 am PST, and closes at 1:15 pm PST). You can read background information on the intraday market reports on the Intraday Market Update page.


Thank you.